Equity Research Based on Artificial Intelligence: Returns up to 666.82% in 1 Year
Equity Research
Equity Research: This Retail Stocks forecast is designed for investors and analysts who need predictions for the best stocks to invest in the retail estate sector (see Retail Stocks Package). It includes 20 stocks with bullish and bearish signals:
- Top 10 Retail stocks for the long position
- Top 10 Retail stocks for the short position
Package Name: Retail Stocks
Recommended Positions: Long
Forecast Length: 1 Year (11/15/20 – 11/16/21)
I Know First Average: 159.08%
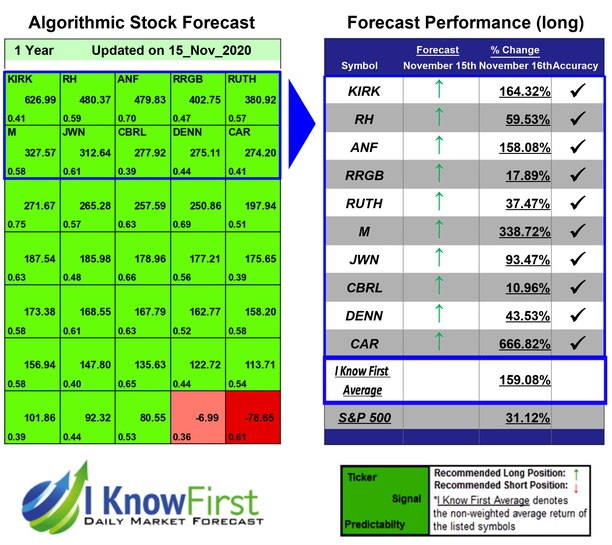

Several predictions in this 1 Year forecast saw significant returns. The algorithm had correctly predicted 10 out of 10 stock movements. The top performing prediction from this package was CAR with a return of 666.82%. M and KIRK followed with returns of 338.72% and 164.32% for the 1 Year period. The package itself saw an overall return of 159.08%, providing investors with a 127.96% premium above the S&P 500’s return of 31.12% for the same time period.
Avis Budget Group, Inc., together with its subsidiaries, provides car and truck rentals, car sharing, and ancillary services to businesses and consumers worldwide. Avis Budget Group, Inc. was founded in 1946 and is headquartered in Parsippany, New Jersey.
Algorithmic traders utilize these daily forecasts by the I Know First market prediction system as a tool to enhance portfolio performance, verify their own analysis and act on market opportunities faster. This forecast was sent to current I Know First subscribers.
How to interpret this diagram
Algorithmic Stock Forecast: The table on the left is a stock forecast produced by I Know First’s algorithm. Each day, subscribers receive forecasts for six different time horizons. Note that the top 10 stocks in the 1-month forecast may be different than those in the 1-year forecast. In the included table, only the relevant stocks have been included. The boxes are arranged according to their respective signal and predictability values (see below for detailed definitions). A green box represents a positive forecast, suggesting a long position, while a red represents a negative forecast, suggesting a short position.
Please note-for trading decisions use the most recent forecast. Get today’s forecast and Top stock picks.