
Energy Stocks To Buy Based on Artificial Intelligence: Returns up to 58.92% in 3 Months
Energy Stocks To Buy
The Energy Stocks To Buy forecast is a part of the the Energy Stocks Package which based on the I Know First algorithm and is designed for investors and analysts who need recommendations for the best performing stocks for the whole Energy Industry. It includes 20 stocks with bullish and bearish signals and indicates the best stocks to buy and sell:
- Top 10 Energy stocks for the long position
- Top 10 Energy stocks for the short position

Package Name: Energy Stocks Forecast
Recommended Positions: Long
Forecast Length: 3 Months (5/2/21 – 8/3/21)
I Know First Average: 17.03%

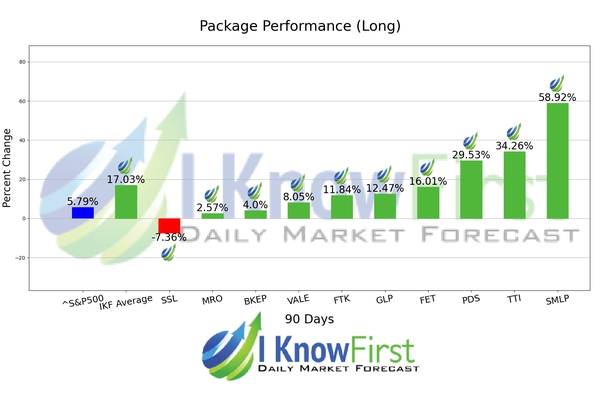
I Know First’s State of the Art Algorithm accurately forecasted 9 out of 10 trades in this Energy Stocks Forecast Package for the 3 Months time period. The greatest return came from SMLP at 58.92%. TTI and PDS followed with returns of 34.26% and 29.53% for the 3 Months period. This algorithmic forecast package presented an overall return of 17.03% versus the S&P 500’s performance of 5.79% providing a market premium of 11.24%.
Summit Midstream Partners, LP (SMLP), focuses on owning, developing, and operating midstream energy infrastructure assets primarily shale formations in North America. The company provides natural gas gathering, treating, and processing services
Algorithmic traders utilize these daily forecasts by the I Know First market prediction system as a tool to enhance portfolio performance, verify their own analysis and act on market opportunities faster. This forecast was sent to current I Know First subscribers.
How to interpret this diagram
Algorithmic Stock Forecast: The table on the left is a stock forecast produced by I Know First’s algorithm. Each day, subscribers receive forecasts for six different time horizons. Note that the top 10 stocks in the 1-month forecast may be different than those in the 1-year forecast. In the included table, only the relevant stocks have been included. The boxes are arranged according to their respective signal and predictability values (see below for detailed definitions). A green box represents a positive forecast, suggesting a long position, while a red represents a negative forecast, suggesting a short position.
Please note-for trading decisions use the most recent forecast. Get today’s forecast and Top stock picks.


