Consumer Stocks Based on Big Data Analytics: Returns up to 21.76% in 14 Days
Consumer Stocks
The Consumer Stocks Package is designed for investors and analysts who need predictions of the best performing stocks for the whole Consumer Industry. It includes 20 stocks with bullish and bearish signals.
- Top 10 Consumer stocks for the long position
- Top 10 Consumer stocks for the short position
Package Name: Consumer Stocks
Recommended Positions: Long
Forecast Length: 14 Days (8/16/2020 – 8/31/2020)
I Know First Average: 6.49%
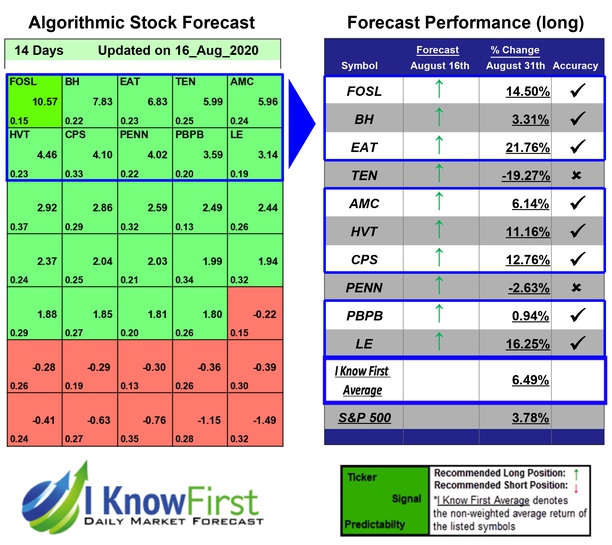
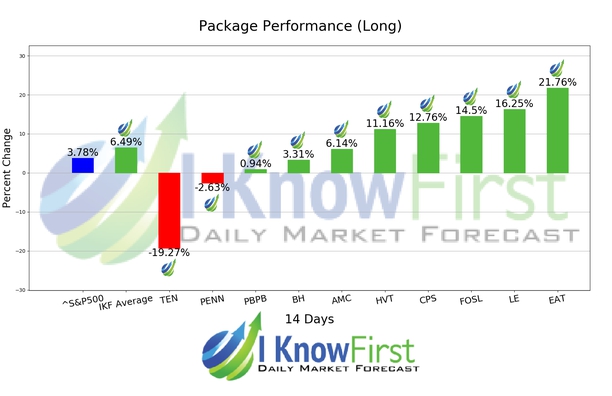
During the 14 Days forecasted period several picks in the Consumer Stocks Package saw significant returns. The algorithm had correctly predicted 8 out 10 returns. The greatest return came from EAT at 21.76%. LE and FOSL also performed well for this time horizon with returns of 16.25% and 14.5%, respectively. The package had an overall average return of 6.49%, providing investors with a premium of 2.71% over the S&P 500’s return of 3.78% during the same period.
Brinker International, Inc. (EAT), together with its subsidiaries, owns, develops, operates, and franchises casual dining restaurants worldwide. As of June 29, 2016, it had 1,660 company-owned and franchised restaurants comprising 1,609 restaurants under the Chili’s Grill & Bar brand name; and 51 restaurants under the Maggiano’s Little Italy brand name. The company was founded in 1975 and is based in Dallas, Texas.
Algorithmic traders utilize these daily forecasts by the I Know First market prediction system as a tool to enhance portfolio performance, verify their own analysis and act on market opportunities faster. This forecast was sent to current I Know First subscribers.
How to interpret this diagram
Algorithmic Stock Forecast: The table on the left is a stock forecast produced by I Know First’s algorithm. Each day, subscribers receive forecasts for six different time horizons. Note that the top 10 stocks in the 1-month forecast may be different than those in the 1-year forecast. In the included table, only the relevant stocks have been included. The boxes are arranged according to their respective signal and predictability values (see below for detailed definitions). A green box represents a positive forecast, suggesting a long position, while a red represents a negative forecast, suggesting a short position.
Please note-for trading decisions use the most recent forecast. Get today’s forecast and Top stock picks.