Consumer Staples Stocks Based on Deep-Learning: Returns up to 79.64% in 3 Months
Consumer Staples Stocks
The Consumer Staples Stocks Package is designed for investors and analysts who need predictions of the best performing stocks for the whole Consumer Industry. It includes 20 stocks with bullish and bearish signals.
- Top 10 Consumer stocks for the long position
- Top 10 Consumer stocks for the short position
Package Name: Consumer Stocks
Recommended Positions: Long
Forecast Length: 3 Months (1/8/21 – 4/9/21)
I Know First Average: 30.92%
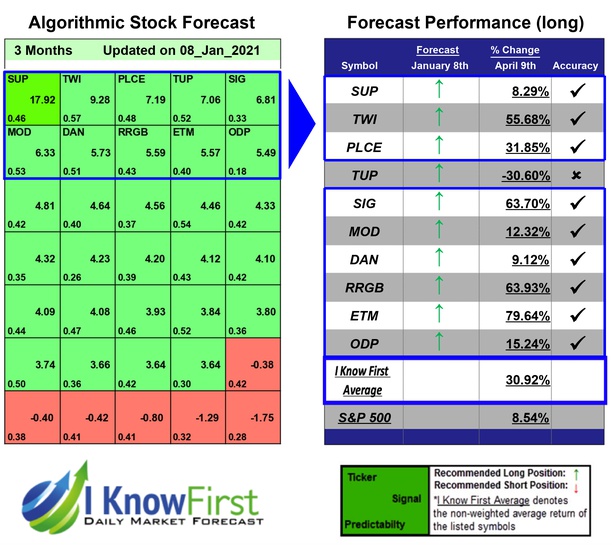
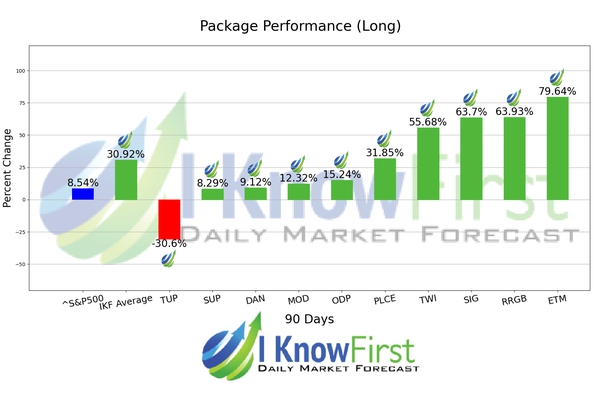
Several predictions in this 3 Months forecast saw significant returns. The algorithm had correctly predicted 9 out 10 stock movements. ETM was the top performing prediction with a return of 79.64%. RRGB and SIG also performed well for this time horizon with returns of 63.93% and 63.7%, respectively. The package had an overall average return of 30.92%, providing investors with a 22.38% premium over the S&P 500’s return of 8.54% during the period.
Entercom Communications Corp. operates as a radio broadcasting company in the United States. The company owns and operates radio stations in various formats, such as news, talk, classic rock, adult contemporary, alternative, country, and others. As of July 21, 2016, its portfolio consisted of 124 radio stations in 27 markets. Entercom Communications Corp. was founded in 1968 and is based in Bala Cynwyd, Pennsylvania.
Algorithmic traders utilize these daily forecasts by the I Know First market prediction system as a tool to enhance portfolio performance, verify their own analysis and act on market opportunities faster. This forecast was sent to current I Know First subscribers.
How to interpret this diagram
Algorithmic Stock Forecast: The table on the left is a stock forecast produced by I Know First’s algorithm. Each day, subscribers receive forecasts for six different time horizons. Note that the top 10 stocks in the 1-month forecast may be different than those in the 1-year forecast. In the included table, only the relevant stocks have been included. The boxes are arranged according to their respective signal and predictability values (see below for detailed definitions). A green box represents a positive forecast, suggesting a long position, while a red represents a negative forecast, suggesting a short position.
Please note-for trading decisions use the most recent forecast. Get today’s forecast and Top stock picks.