Consumer Staples Stocks Based on Deep Learning: Returns up to 67.73% in 1 Month
Consumer Staples Stocks
The Consumer Staples Stocks Package is designed for investors and analysts who need predictions of the best performing stocks for the whole Consumer Industry. It includes 20 stocks with bullish and bearish signals.
- Top 10 Consumer stocks for the long position
- Top 10 Consumer stocks for the short position
Package Name: Consumer Stocks
Recommended Positions: Long
Forecast Length: 1 Month (5/17/2020 – 6/17/2020)
I Know First Average: 33.76%
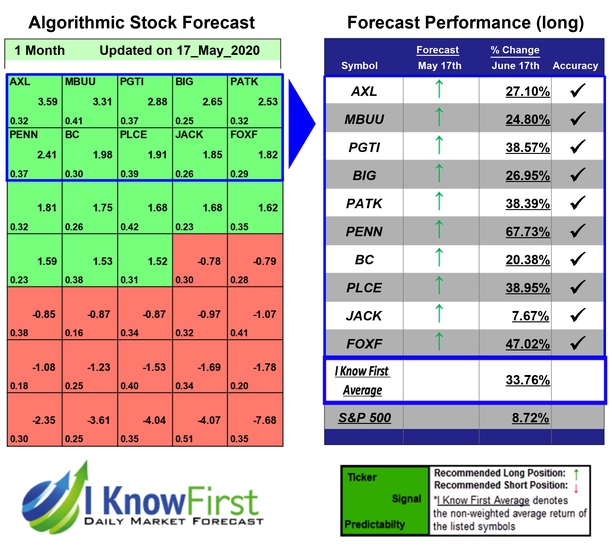
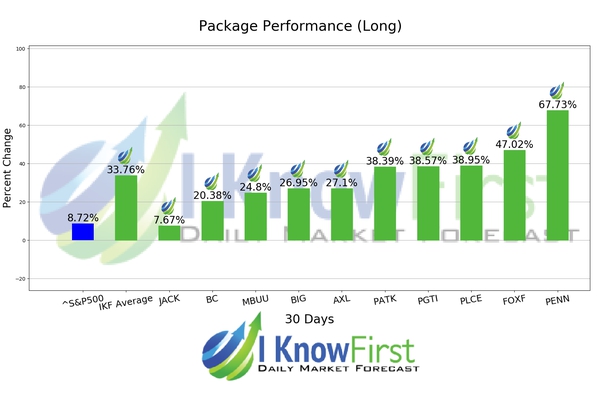
During the 1 Month forecasted period several picks in the Consumer Stocks Package saw significant returns. The algorithm had correctly predicted 10 out 10 returns. PENN was our best stock pick this week a return of 67.73%. Further notable returns came from FOXF and PLCE at 47.02% and 38.95%, respectively. The package itself saw an overall return of 33.76%, providing investors with a 25.04% premium above the S&P 500’s return of 8.72% for the same time period.
Penn National Gaming, Inc. (Penn), incorporated on December 16, 1982, is an owner and manager of gaming and racing facilities, and video gaming terminal operations with a focus on slot machine entertainment. The Company operates through three segments: Northeast, South/West and Midwest. As of December 31, 2016, the Company operated 27 facilities in 17 jurisdictions, including Florida, Illinois, Indiana, Kansas, Maine, Massachusetts, Mississippi, Missouri, Nevada, New Jersey, New Mexico, Ohio, Pennsylvania, Texas, West Virginia, California and Ontario.
Algorithmic traders utilize these daily forecasts by the I Know First market prediction system as a tool to enhance portfolio performance, verify their own analysis and act on market opportunities faster. This forecast was sent to current I Know First subscribers.
How to interpret this diagram
Algorithmic Stock Forecast: The table on the left is a stock forecast produced by I Know First’s algorithm. Each day, subscribers receive forecasts for six different time horizons. Note that the top 10 stocks in the 1-month forecast may be different than those in the 1-year forecast. In the included table, only the relevant stocks have been included. The boxes are arranged according to their respective signal and predictability values (see below for detailed definitions). A green box represents a positive forecast, suggesting a long position, while a red represents a negative forecast, suggesting a short position.
Please note-for trading decisions use the most recent forecast. Get today’s forecast and Top stock picks.