Consumer Discretionary Stocks Based on Machine Learning: Returns up to 278.92% in 7 Days
Consumer Discretionary Stocks
The Consumer Discretionary Stocks Package is designed for investors and analysts who need predictions of the best performing stocks for the whole Consumer Industry. It includes 20 stocks with bullish and bearish signals.
- Top 10 Consumer stocks for the long position
- Top 10 Consumer stocks for the short position
Package Name: Consumer Stocks
Recommended Positions: Long
Forecast Length: 7 Days (1/24/21 – 2/1/21)
I Know First Average: 72.33%
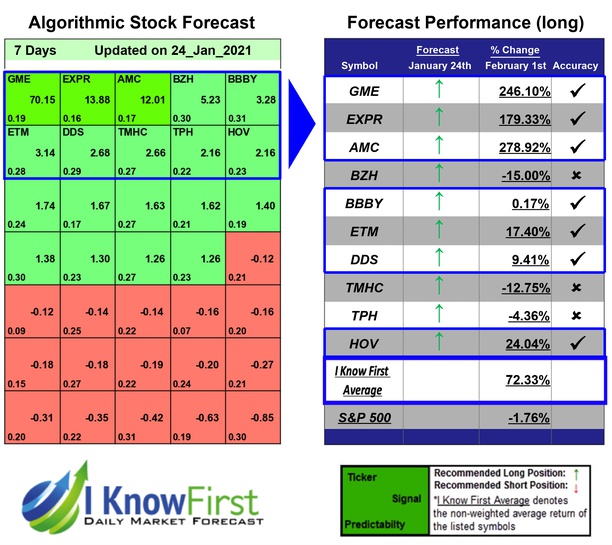
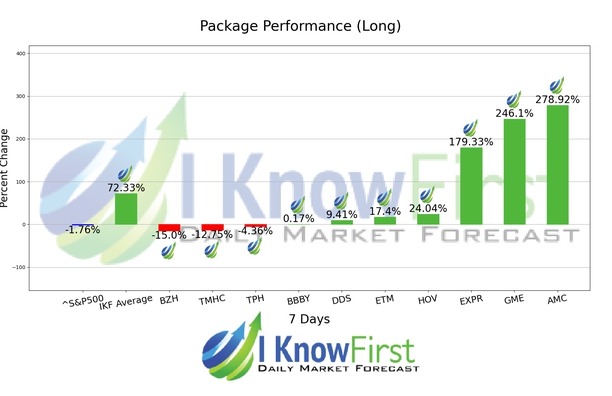
This Consumer Stocks Package forecast had correctly predicted 7 out of 10 stock movements. The top performing prediction from this package was AMC with a return of 278.92%. GME and EXPR followed with returns of 246.1% and 179.33% for the 7 Days period. The package itself saw an overall return of 72.33%, providing investors with a 74.09% premium above the S&P 500’s return of -1.76% for the same time period.
AMC Entertainment Holdings, Inc. (AMC), through its subsidiaries, operates as a theatrical exhibition company in the United States and internationally. It owns, operates, or has interests in theatres. As of June 30, 2016, the company owned, operated, or had interests in 386 theatres with 5,334 screens primarily in the United States. The company was founded in 1920 and is headquartered in Leawood, Kansas. AMC Entertainment Holdings, Inc. (AMC) operates as a subsidiary of Wanda America Investment Holding Co. Ltd.
Algorithmic traders utilize these daily forecasts by the I Know First market prediction system as a tool to enhance portfolio performance, verify their own analysis and act on market opportunities faster. This forecast was sent to current I Know First subscribers.
How to interpret this diagram
Algorithmic Stock Forecast: The table on the left is a stock forecast produced by I Know First’s algorithm. Each day, subscribers receive forecasts for six different time horizons. Note that the top 10 stocks in the 1-month forecast may be different than those in the 1-year forecast. In the included table, only the relevant stocks have been included. The boxes are arranged according to their respective signal and predictability values (see below for detailed definitions). A green box represents a positive forecast, suggesting a long position, while a red represents a negative forecast, suggesting a short position.
Please note-for trading decisions use the most recent forecast. Get today’s forecast and Top stock picks.