Consumer Discretionary Stocks Based on Data Mining: Returns up to 73.78% in 1 Month
Consumer Discretionary Stocks
The Consumer Stocks Package is designed for investors and analysts who need predictions of the best performing stocks for the whole Consumer Industry. It includes 20 consumer discretionary stocks with bullish and bearish signals.
- Top 10 Consumer stocks for the long position
- Top 10 Consumer stocks for the short position
Package Name: Consumer Stocks
Recommended Positions: Long
Forecast Length: 1 Month (8/9/2019 – 9/10/2019)
I Know First Average: 9.91%
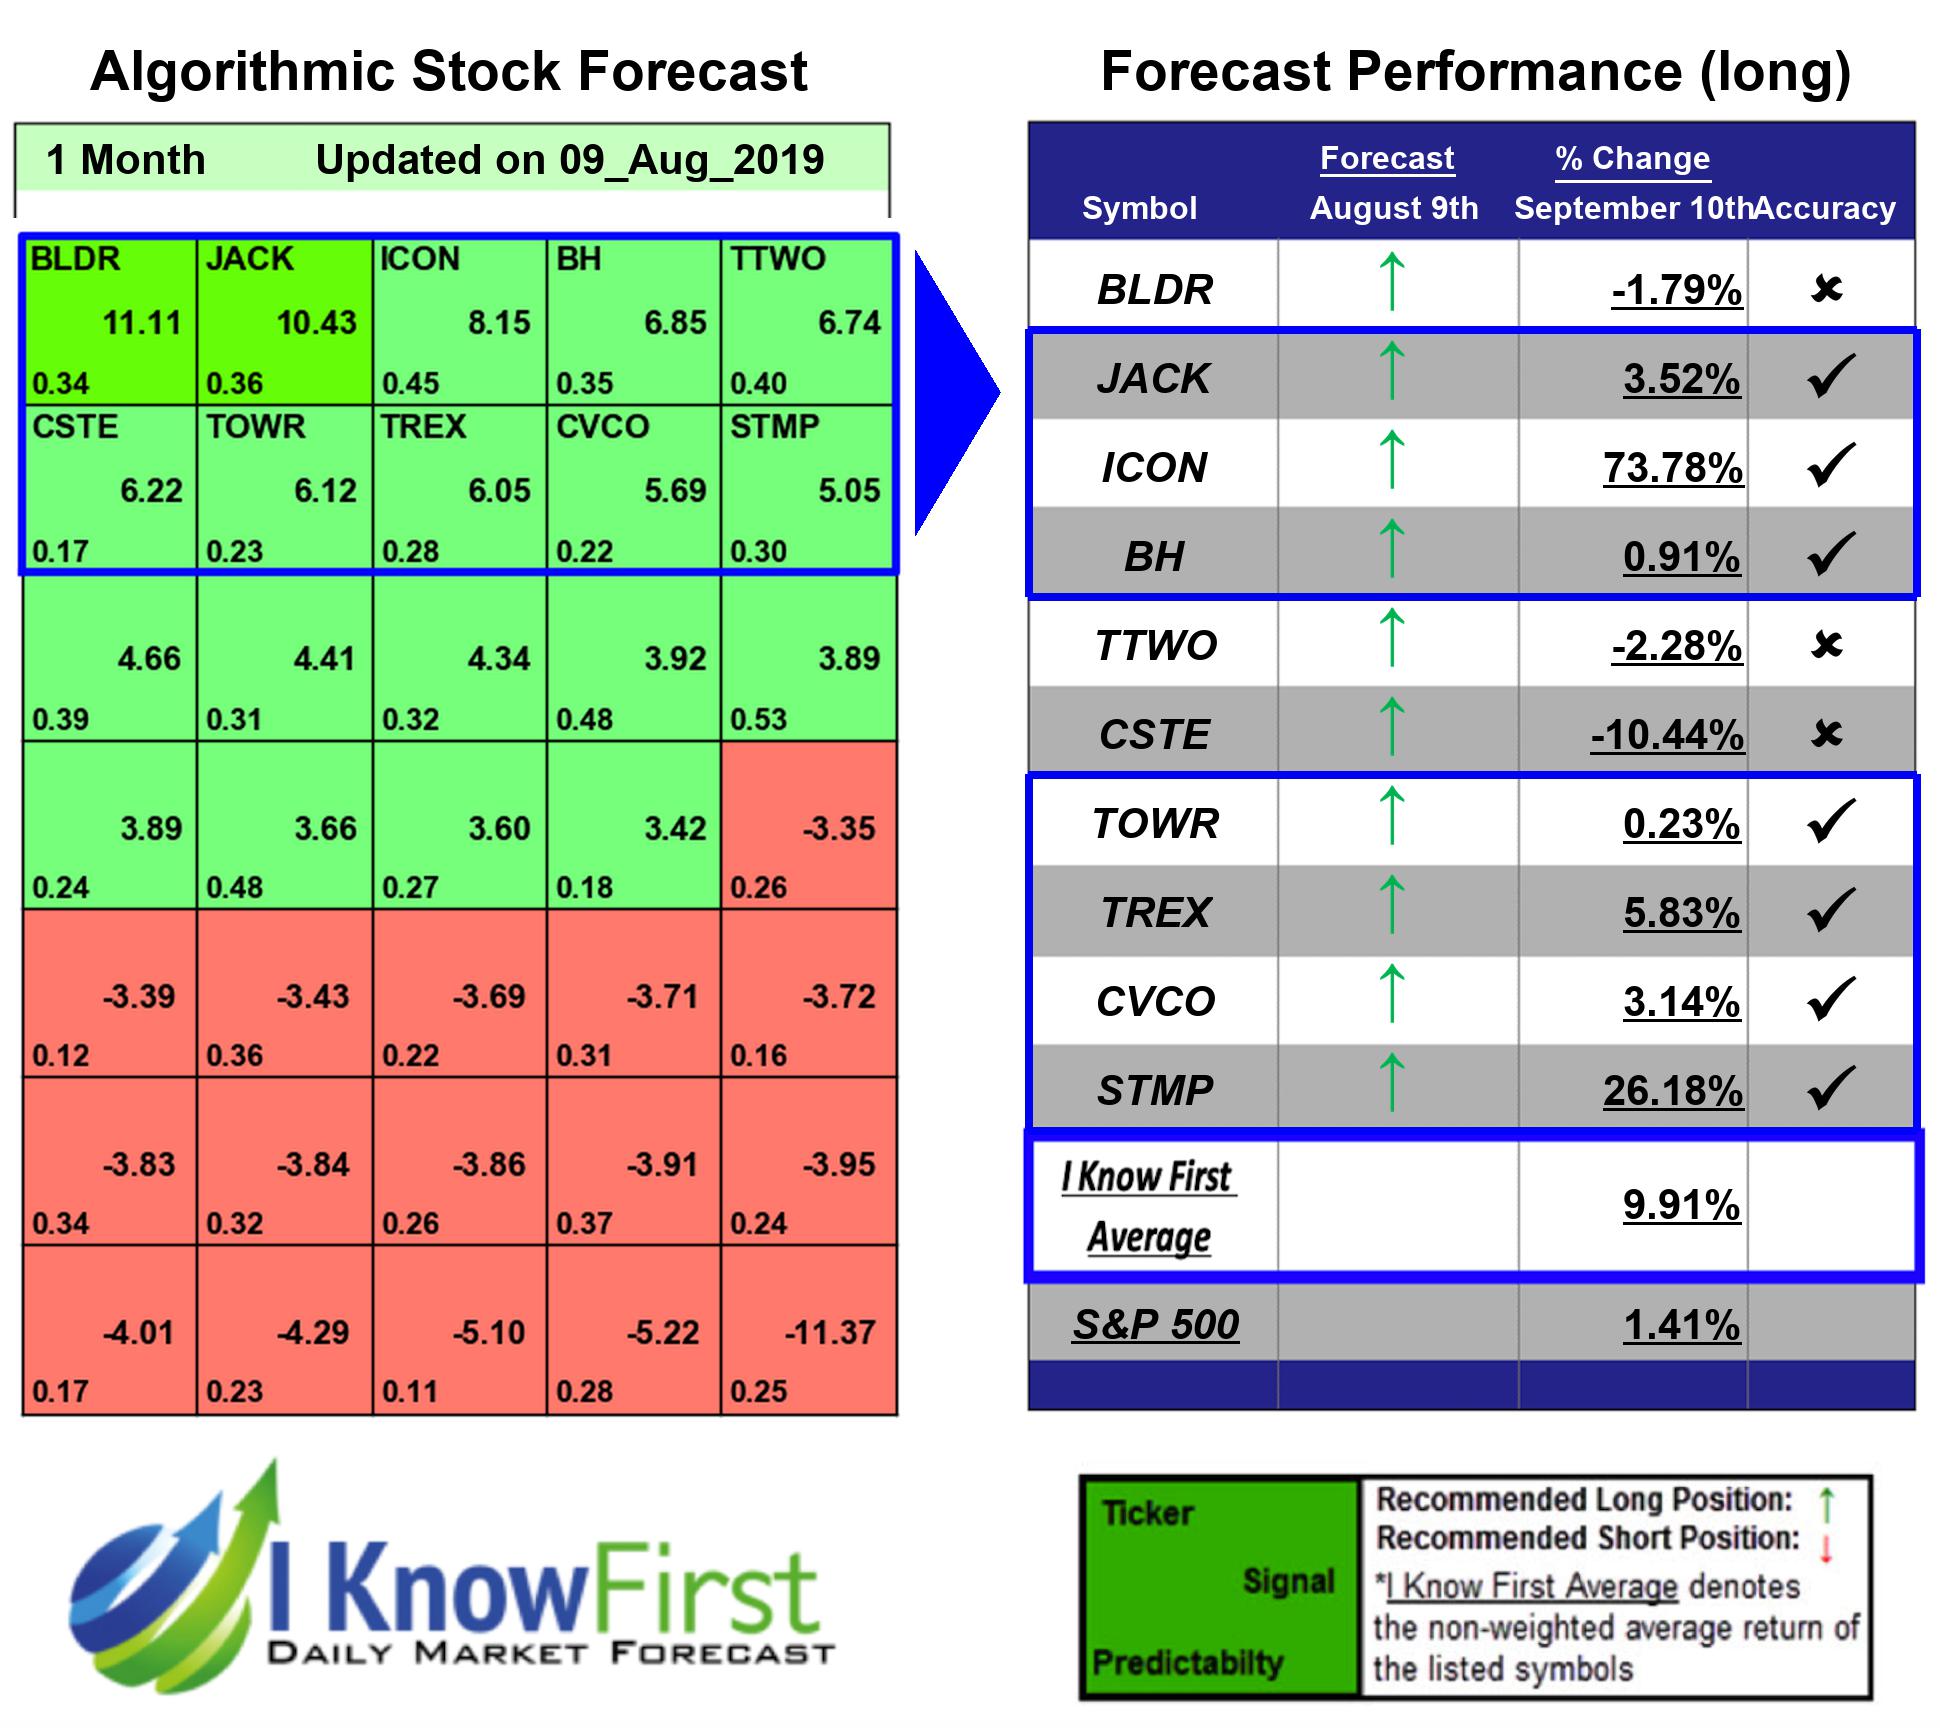

In this 1 Month forecast for the Consumer Stocks Package, there were many high performing trades and the algorithm correctly predicted 7 out 10 trades. The top performing prediction from this package was ICON with a return of 73.78%. STMP and TREX saw outstanding returns of 26.18% and 5.83%. The package itself saw an overall return of 9.91%, providing investors with a 8.50% premium above the S&P 500’s return of 1.41% for the same time period.
Iconix Brand Group, Inc., incorporated on June 17, 2005, is a brand management company. As of December 31, 2016, the Company owned a portfolio of over 30 global consumer brands across women’s, men’s, home categories. The Company operates through five segments: men’s, women’s, home and international. The Company’s brand portfolio includes brands, such as Candie’s, Bongo, Joe Boxer, Rampage, Mudd, London Fog, Mossimo, Ocean Pacific/OP, Danskin/Danskin Now, Rocawear/Roc Nation, Cannon, Royal Velvet, Fieldcrest, Charisma, Starter, Waverly, Ecko Unltd/Mark Ecko Cut & Sew, Zoo York, Sharper Image, Umbro, Lee Cooper and Artful Dodger, and interests in Material Girl, Ed Hardy, Truth or Dare, Modern Amusement, Buffalo, Nick Graham Hydraulic and PONY brands. It operates in various geographic regions, including the United States, Japan and Other (which principally represent Latin America and Europe).
Algorithmic traders utilize these daily forecasts by the I Know First market prediction system as a tool to enhance portfolio performance, verify their own analysis and act on market opportunities faster. This forecast was sent to current I Know First subscribers.
How to interpret this diagram
Algorithmic Stock Forecast: The table on the left is a stock forecast produced by I Know First’s algorithm. Each day, subscribers receive forecasts for six different time horizons. Note that the top 10 stocks in the 1-month forecast may be different than those in the 1-year forecast. In the included table, only the relevant stocks have been included. The boxes are arranged according to their respective signal and predictability values (see below for detailed definitions). A green box represents a positive forecast, suggesting a long position, while a red represents a negative forecast, suggesting a short position.
Please note-for trading decisions use the most recent forecast. Get today’s forecast and Top stock picks.