Consumer Discretionary Stocks Based on Algorithmic Trading: Returns up to 10.65% in 14 Days
Consumer Discretionary Stocks
The Consumer Discretionary Stocks Package is designed for investors and analysts who need predictions of the best performing stocks for the whole Consumer Industry. It includes 20 stocks with bullish and bearish signals.
- Top 10 Consumer stocks for the long position
- Top 10 Consumer stocks for the short position
Package Name: Consumer Stocks
Recommended Positions: Long
Forecast Length: 14 Days (7/18/21 – 8/1/21)
I Know First Average: 3.38%
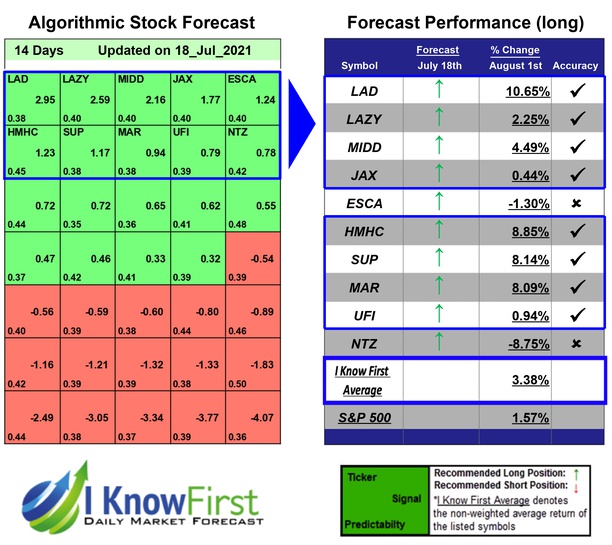

Several predictions in this 14 Days forecast saw significant returns. The algorithm had correctly predicted 8 out 10 stock movements. The greatest return came from LAD at 10.65%. HMHC and SUP also performed well for this time horizon with returns of 8.85% and 8.14%, respectively. The overall average return in this Consumer Stocks package was 3.38%, providing investors with a 1.81% premium over the S&P 500’s return of 1.57% during the same period.
Lithia Motors, Inc. (LAD) operates as an automotive franchises and a retailer of new and used vehicles in the United States. The company operates through three segments: Domestic, Import, and Luxury. It sells new and used cars, replacement parts, service contracts, vehicle protection products, and credit insurance products; provides vehicle maintenance, warranty, paint, and repair services; and arranges related financing. As of September 1, 2016, the company offered 31 brands of new vehicles and various brands of used vehicles in 141 stores in the United States; and online through Lithia.com and DCHauto.com. Lithia Motors, Inc. (LAD) was founded in 1946 and is headquartered in Medford, Oregon.
Algorithmic traders utilize these daily forecasts by the I Know First market prediction system as a tool to enhance portfolio performance, verify their own analysis and act on market opportunities faster. This forecast was sent to current I Know First subscribers.
How to interpret this diagram
Algorithmic Stock Forecast: The table on the left is a stock forecast produced by I Know First’s algorithm. Each day, subscribers receive forecasts for six different time horizons. Note that the top 10 stocks in the 1-month forecast may be different than those in the 1-year forecast. In the included table, only the relevant stocks have been included. The boxes are arranged according to their respective signal and predictability values (see below for detailed definitions). A green box represents a positive forecast, suggesting a long position, while a red represents a negative forecast, suggesting a short position.
Please note-for trading decisions use the most recent forecast. Get today’s forecast and Top stock picks.