
Consumer Defensive Stocks Based on Big Data Analytics : Returns up to 2.32% in 7 Days
Consumer Defensive Stocks
This Conservative Stock forecast is part of the Risk-Conscious Package, as one of I Know First’s quantitative investment solutions. We determine our best consumer defensive stocks by screening our database daily for lower volatility stocks that are less risky. The full Risk-Conscious Package includes a daily forecast for a total of 40 stocks divided into four main categories:
- Top 10 Conservative stocks for the long position
- Top 10 Conservative stocks for the short position
- Top 10 Aggressive stocks for the long position
- Top 10 Aggressive stocks for the short position

Package Name: Conservative Stock Forecast
Recommended Positions: Long
Forecast Length: 7 Days (9/13/2019 – 9/21/2019)
I Know First Average: 0.39%
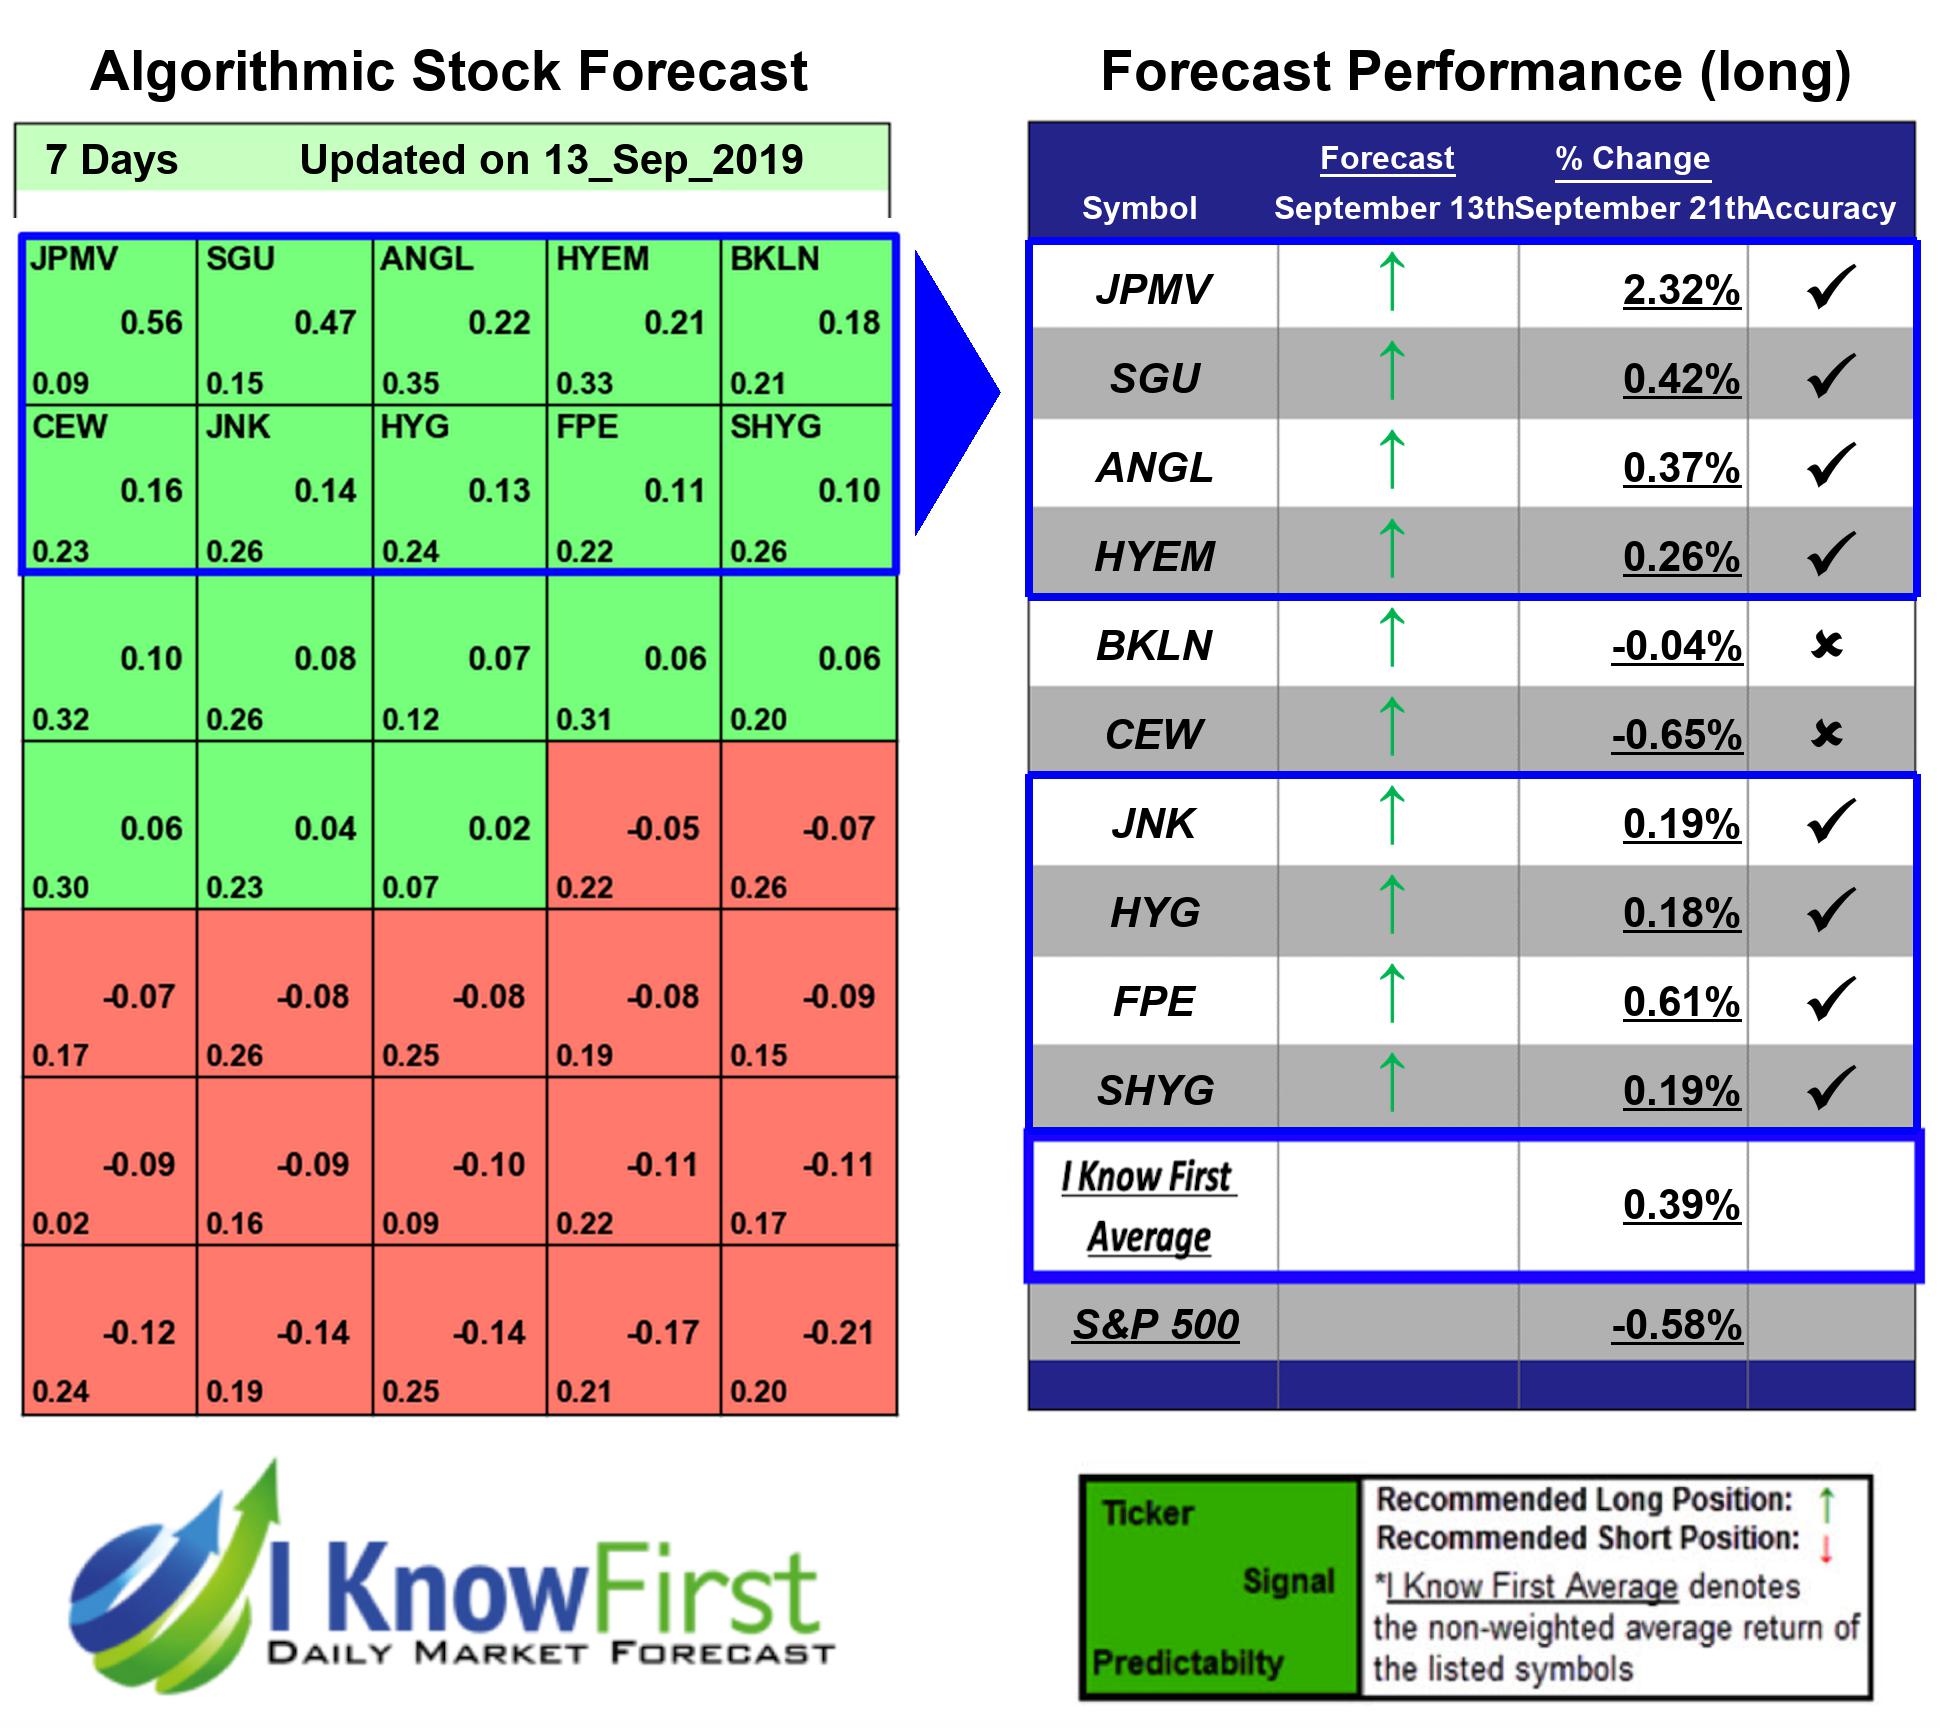

Several predictions in this 7 Days forecast saw significant returns. The algorithm had correctly predicted 8 out 10 stock movements. The greatest return came from JPMV at 2.32%. FPE, and SGU had notable returns of 0.61% and 0.42%. The overall average return in this Conservative Stock Forecast package was 0.39%, providing investors with a 0.97% premium over the S&P 500’s return of -0.58% during the same period.
Algorithmic traders utilize these daily forecasts by the I Know First market prediction system as a tool to enhance portfolio performance, verify their own analysis and act on market opportunities faster. This forecast was sent to current I Know First subscribers.
How to interpret this diagram
Algorithmic Stock Forecast: The table on the left is a stock forecast produced by I Know First’s algorithm. Each day, subscribers receive forecasts for six different time horizons. Note that the top 10 stocks in the 1-month forecast may be different than those in the 1-year forecast. In the included table, only the relevant stocks have been included. The boxes are arranged according to their respective signal and predictability values (see below for detailed definitions). A green box represents a positive forecast, suggesting a long position, while a red represents a negative forecast, suggesting a short position.
Please note-for trading decisions use the most recent forecast. Get today’s forecast and Top stock picks.


