
Chinese Stocks ETF Based on Pattern Recognition: Returns up to 7.97% in 14 Days
Chinese Stocks ETF
This forecast is part of the ETFs Package, as one of I Know First’s quantitative investment solutions. We determine the top ETFs by screening our database daily using our advanced algorithm. The full ETFs Package includes a daily forecast for a total of 20 Chinese Stocks ETF ETFs with bullish and bearish signals:
- Top 10 Chinese ETFs for the long position
- Top 10 Chinese ETFs for the short position
Package Name: Chinese ETF Forecast
Recommended Positions: Long
Forecast Length: 14 Days (12/25/2019 – 1/8/2020)
I Know First Average: 4.14%
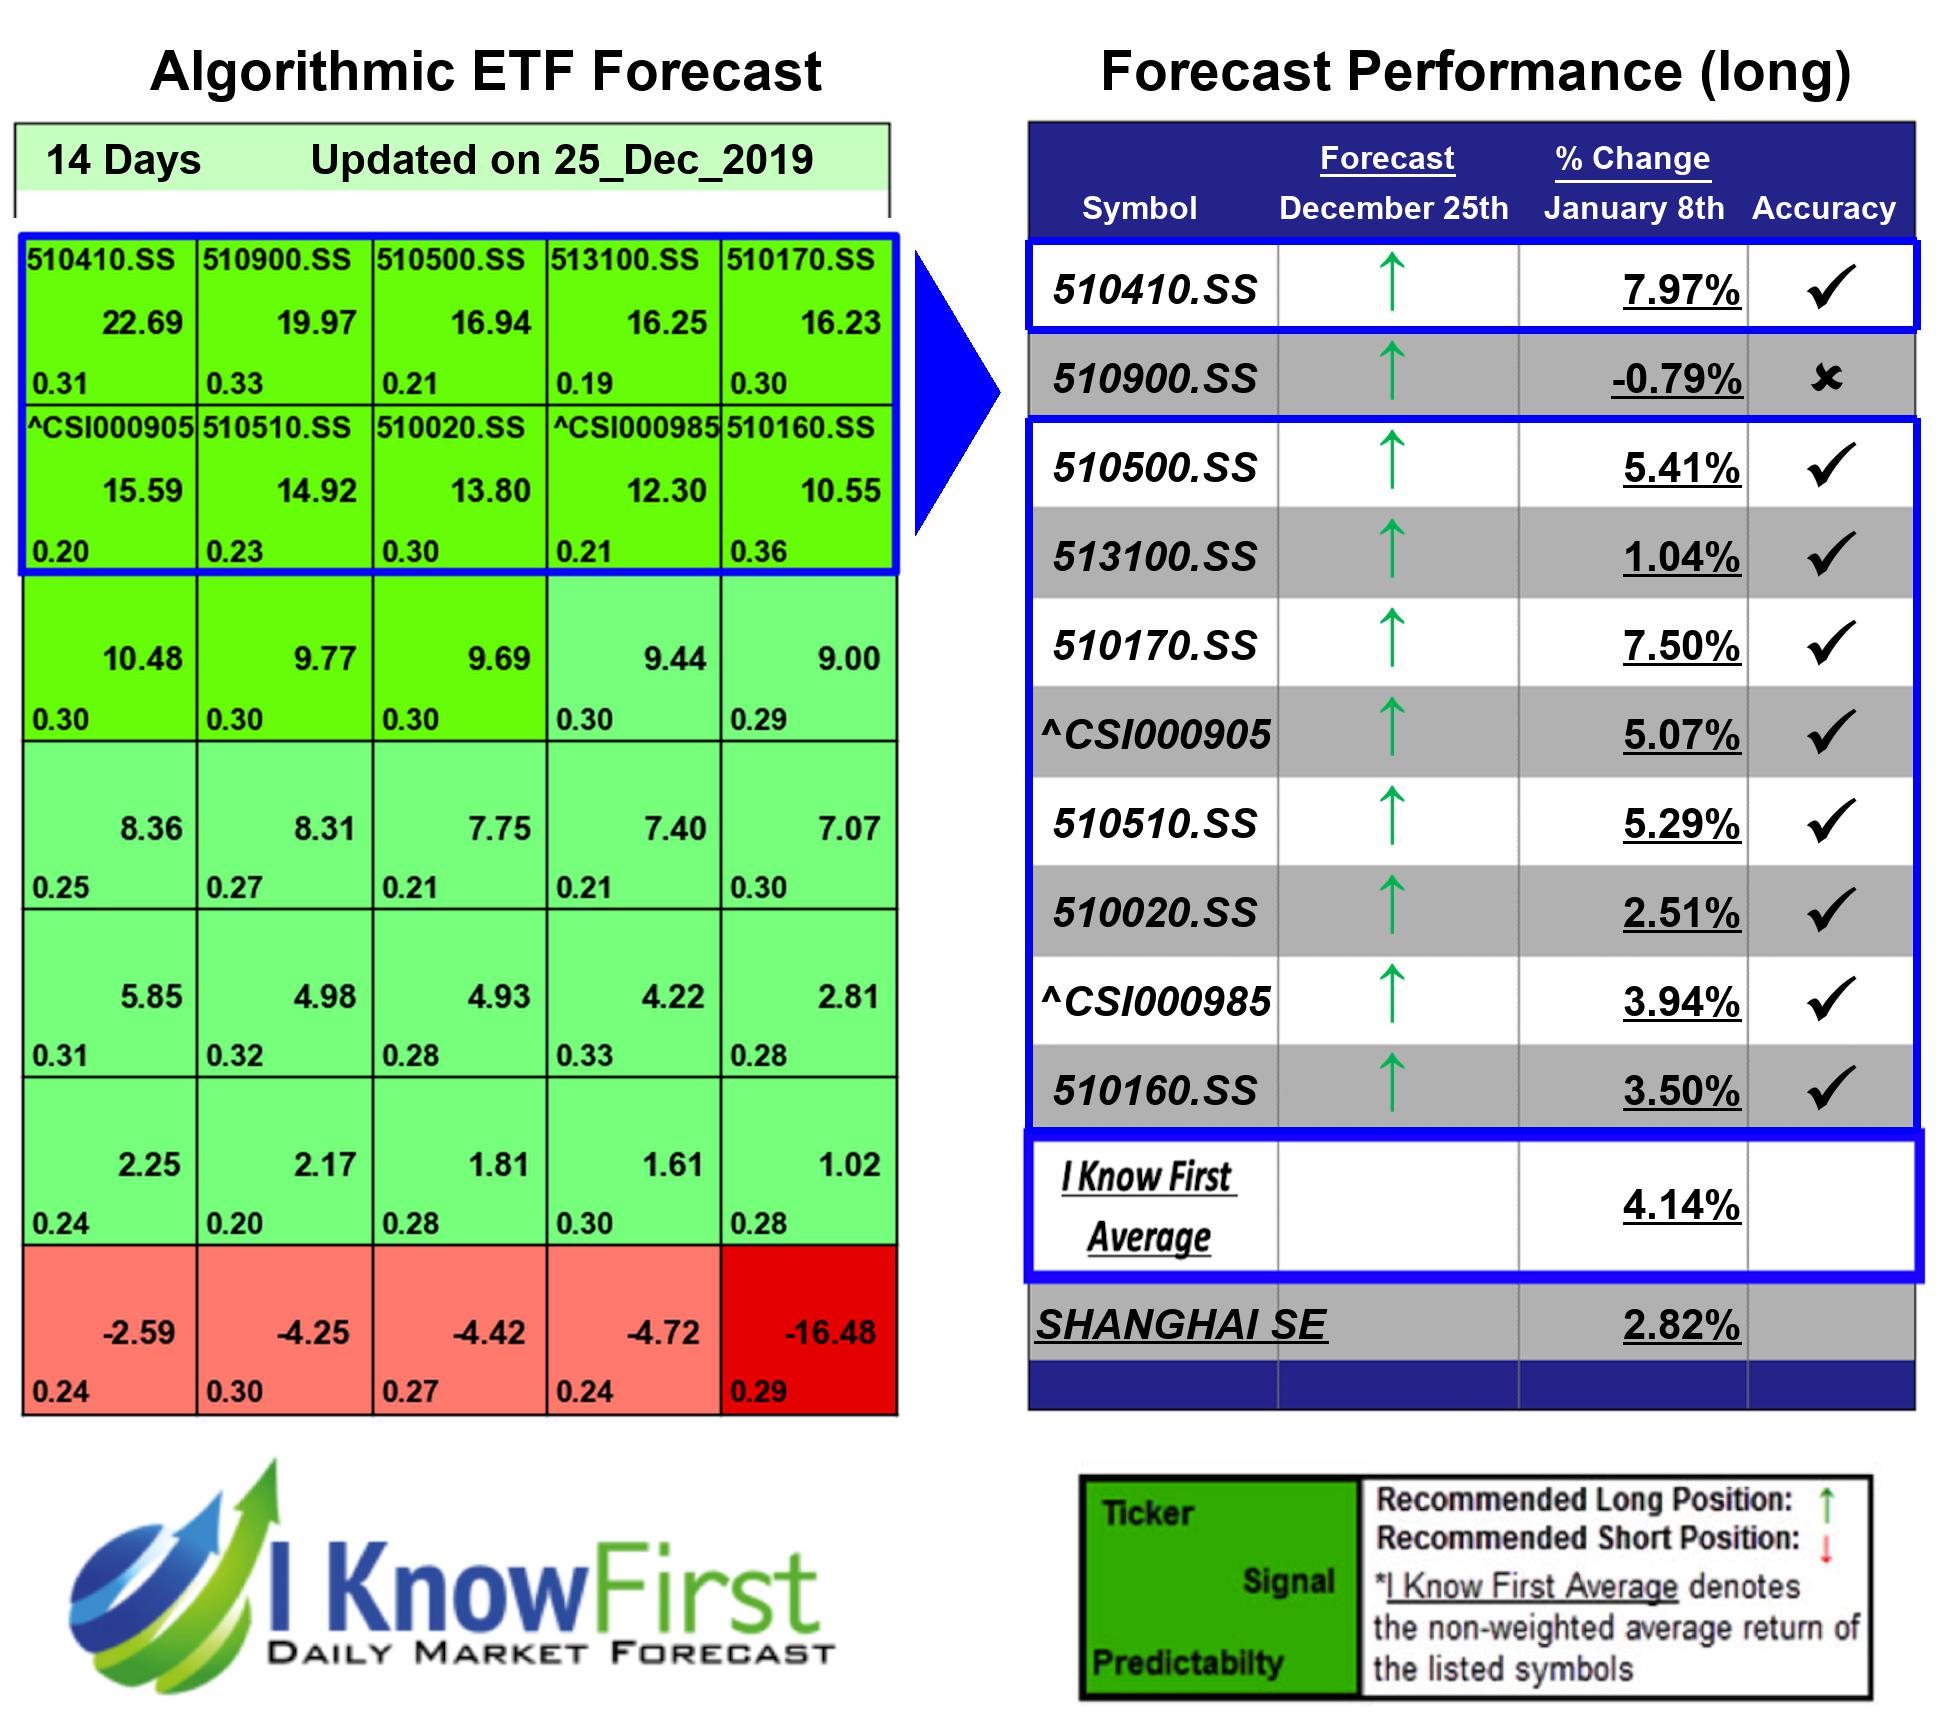

The algorithm correctly predicted 9 out 10 of the suggested trades in the Chinese ETF Forecast Package for this 14 Days forecast. The prediction with the highest return was 510410.SS, at 7.97%. 510170.SS, and 510500.SS had notable returns of 7.5% and 5.41%. The package had an overall average return of 4.14%, providing investors with a 1.32% premium over the SHANGHAI SE’s return of 2.82% during the period.
Bosera SSE Natural Resource Index ETF is an exchange-traded fund incorporated in China. The Fund’s objective is to track the performance of the SSE Natural Resource Index while minimizing the tracking errors. The Fund invests at least 90% of total assets in equities of SSE Natural Resource Index. The remaining proportion is invested in bonds, options and other financial tools.
Algorithmic traders utilize these daily forecasts by the I Know First market prediction system as a tool to enhance portfolio performance, verify their own analysis and act on market opportunities faster. This forecast was sent to current I Know First subscribers.
How to interpret this diagram
Algorithmic Stock Forecast: The table on the left is a stock forecast produced by I Know First’s algorithm. Each day, subscribers receive forecasts for six different time horizons. Note that the top 10 stocks in the 1-month forecast may be different than those in the 1-year forecast. In the included table, only the relevant stocks have been included. The boxes are arranged according to their respective signal and predictability values (see below for detailed definitions). A green box represents a positive forecast, suggesting a long position, while a red represents a negative forecast, suggesting a short position.
Please note-for trading decisions use the most recent forecast. Get today’s forecast and Top stock picks.


