
China ETFs Based on Deep-Learning : Returns up to 5.1% in 14 Days
China ETFs
This forecast is part of the ETFs Package, as one of I Know First’s quantitative investment solutions. We determine the top ETFs by screening our database daily using our advanced algorithm. The full ETFs Package includes a daily forecast for a total of 20 China ETFs ETFs with bullish and bearish signals:
- Top 10 Chinese ETFs for the long position
- Top 10 Chinese ETFs for the short position
Package Name: Chinese ETF Forecast
Recommended Positions: Long
Forecast Length: 14 Days (8/21/2019 – 9/4/2019)
I Know First Average: 3.57%

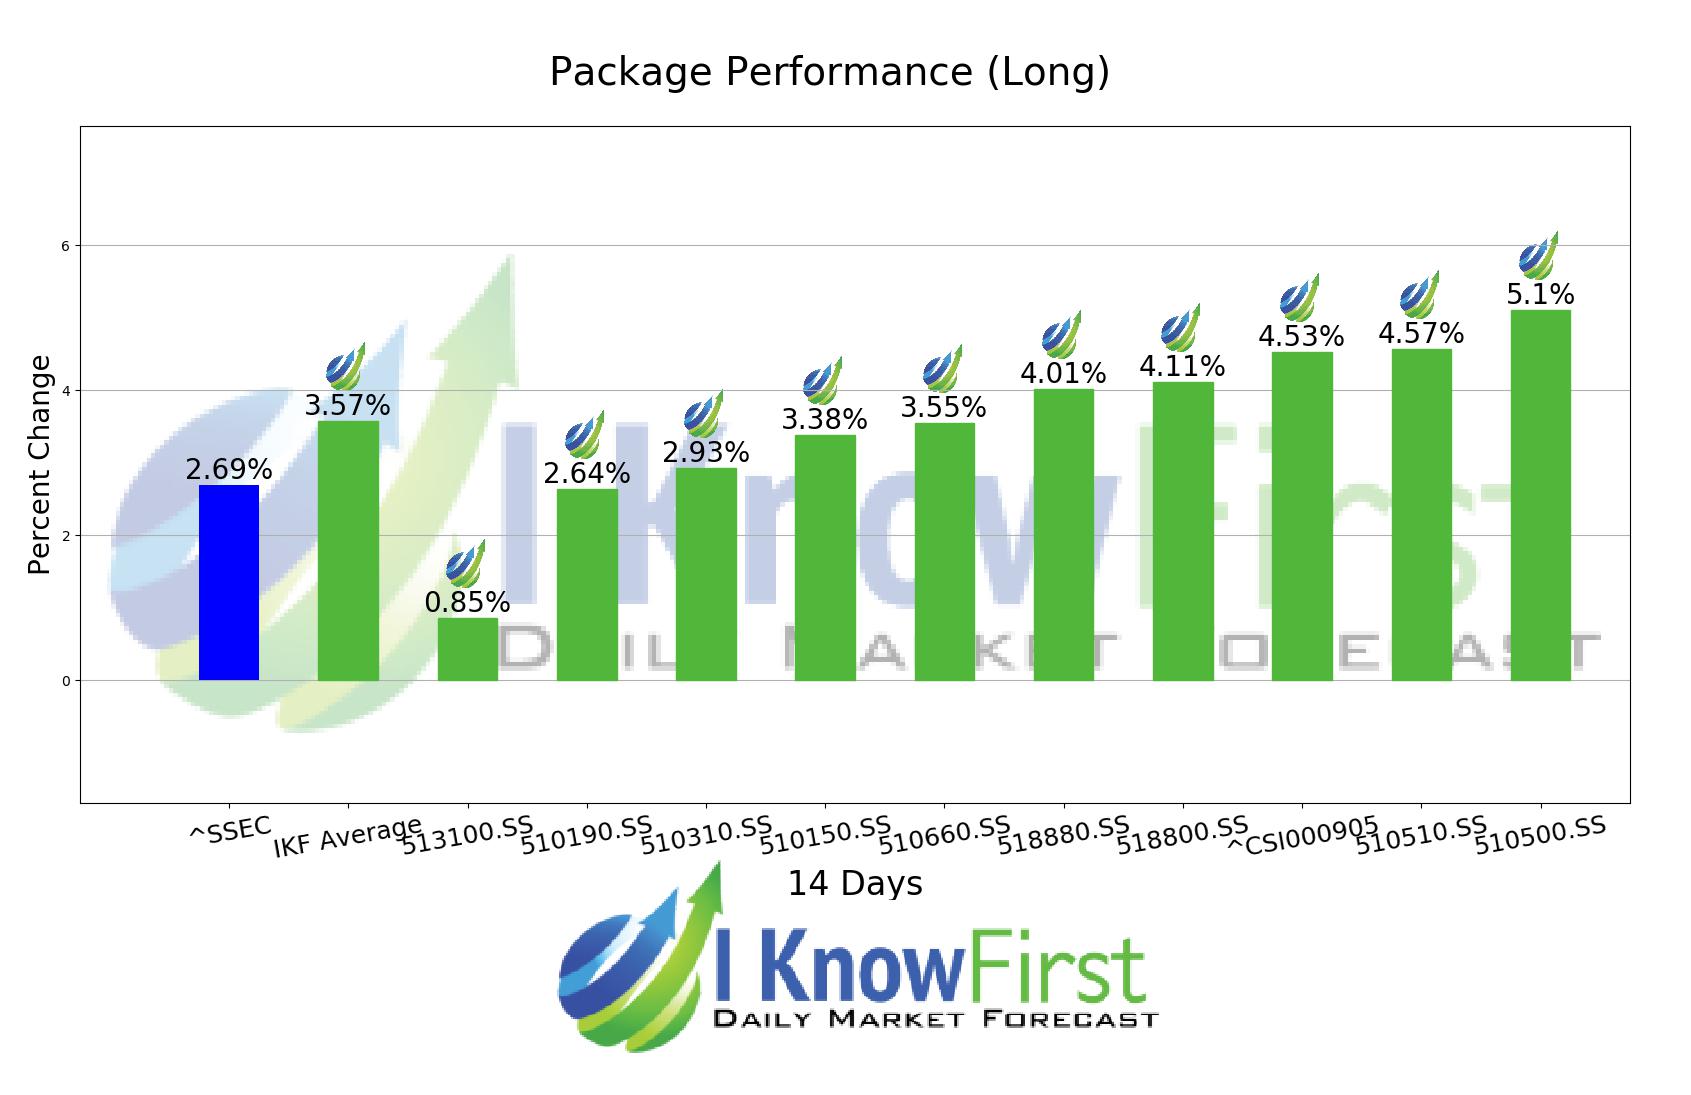
I Know First’s State of the Art Algorithm accurately forecasted 10 out of 10 trades in this Chinese ETF Forecast Package for the 14 Days time period. The greatest return came from 510500.SS at 5.1%. Additional high returns came from 510510.SS and ^CSI000905, at 4.57% and 4.53% respectively. The package had an overall average hit ratio of 3.57% during the period.
China CSI 500 ETF is an exchange-traded fund (ETF) incorporated in China. The Fund’s objective is to track the performance of the CSI 500 Index while minimizing the tracking errors. The Fund invests at least 95% of total assets in equities of member companies of the CSI 500 Index.
Algorithmic traders utilize these daily forecasts by the I Know First market prediction system as a tool to enhance portfolio performance, verify their own analysis and act on market opportunities faster. This forecast was sent to current I Know First subscribers.
How to interpret this diagram
Algorithmic Stock Forecast: The table on the left is a stock forecast produced by I Know First’s algorithm. Each day, subscribers receive forecasts for six different time horizons. Note that the top 10 stocks in the 1-month forecast may be different than those in the 1-year forecast. In the included table, only the relevant stocks have been included. The boxes are arranged according to their respective signal and predictability values (see below for detailed definitions). A green box represents a positive forecast, suggesting a long position, while a red represents a negative forecast, suggesting a short position.
Please note-for trading decisions use the most recent forecast. Get today’s forecast and Top stock picks.


