
Brazil Stocks Based on Pattern Recognition: Returns up to 43.91% in 1 Month
Brazil Stocks
This forecast was generated by the I Know First Algorithm through its analysis of Brazil stock market data and is part of the By Country Package. The full forecast includes daily predictions for a total of 20 Brazil stocks with bullish and bearish signals:
- Top 10 Brazil stocks for the long position
- Top 10 Brazil stocks for the short position
![]()
![]()
Package Name: By Country – Brazilian Stocks
Recommended Positions: Long
Forecast Length: 1 Month (3/7/21 – 4/7/21)
I Know First Average: 11.39%
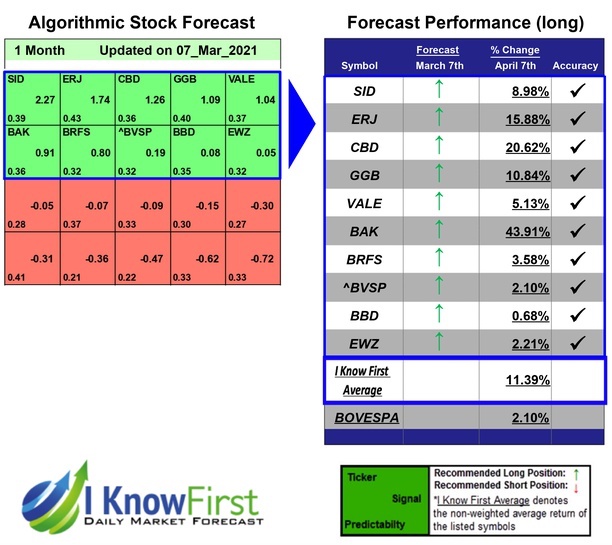
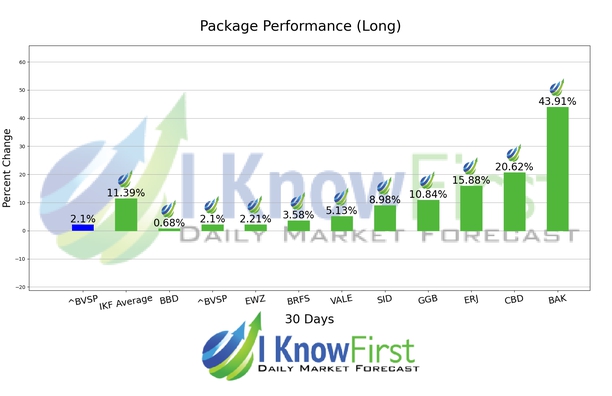
10 out of 10 stock prices in this forecast for the By Country – Brazilian Stocks Package moved as predicted by the algorithm. BAK was the highest-earning trade with a return of 43.91% in 1 Month. CBD and ERJ followed with returns of 20.62% and 15.88% for the 1 Month period. The package had an overall average return of 11.39%, providing investors with a 9.29% premium over the Bovespa’s return of 2.1% during the period.
Braskem S.A. (BAK) Braskem S.A., together with its subsidiaries, produces and sells thermoplastic resins. Its Basic Petrochemicals segment offers olefins, such as ethylene, polymer and chemical grade propylene, butadiene, isoprene, and butene-1; BTX products comprising benzene, toluene, ortho-xylene, para-xylene, and mixed xylenes; fuels, including automotive gasoline and liquefied petroleum gas; intermediates, such as cumene; and other basic petrochemicals, which include ethyl tertiary butyl ether, solvent C9, and pyrolysis C9.
Algorithmic traders utilize these daily forecasts by the I Know First market prediction system as a tool to enhance portfolio performance, verify their own analysis and act on market opportunities faster. This forecast was sent to current I Know First subscribers.
How to interpret this diagram
Algorithmic Stock Forecast: The table on the left is a stock forecast produced by I Know First’s algorithm. Each day, subscribers receive forecasts for six different time horizons. Note that the top 10 stocks in the 1-month forecast may be different than those in the 1-year forecast. In the included table, only the relevant stocks have been included. The boxes are arranged according to their respective signal and predictability values (see below for detailed definitions). A green box represents a positive forecast, suggesting a long position, while a red represents a negative forecast, suggesting a short position.
Please note-for trading decisions use the most recent forecast. Get today’s forecast and Top stock picks.


