Brazil Stock Market Based on Stock Market Algorithm: Returns up to 152.55% in 3 Months
Brazil Stock Market
This Bovespa Stock forecast was generated by the I Know First Algorithm through its analysis of Brazil stock market data and is part of the By Country Package. The full forecast includes daily predictions for a total of 20 stocks with bullish and bearish signals:
- Top 10 Bovespa stocks for the long position
- Top 10 Bovespa stocks for the short position
![]()
![]()
Package Name: Bovespa
Recommended Positions: Long
Forecast Length: 3 Months (5/22/2019 – 8/22/2019)
I Know First Average: 37.38%
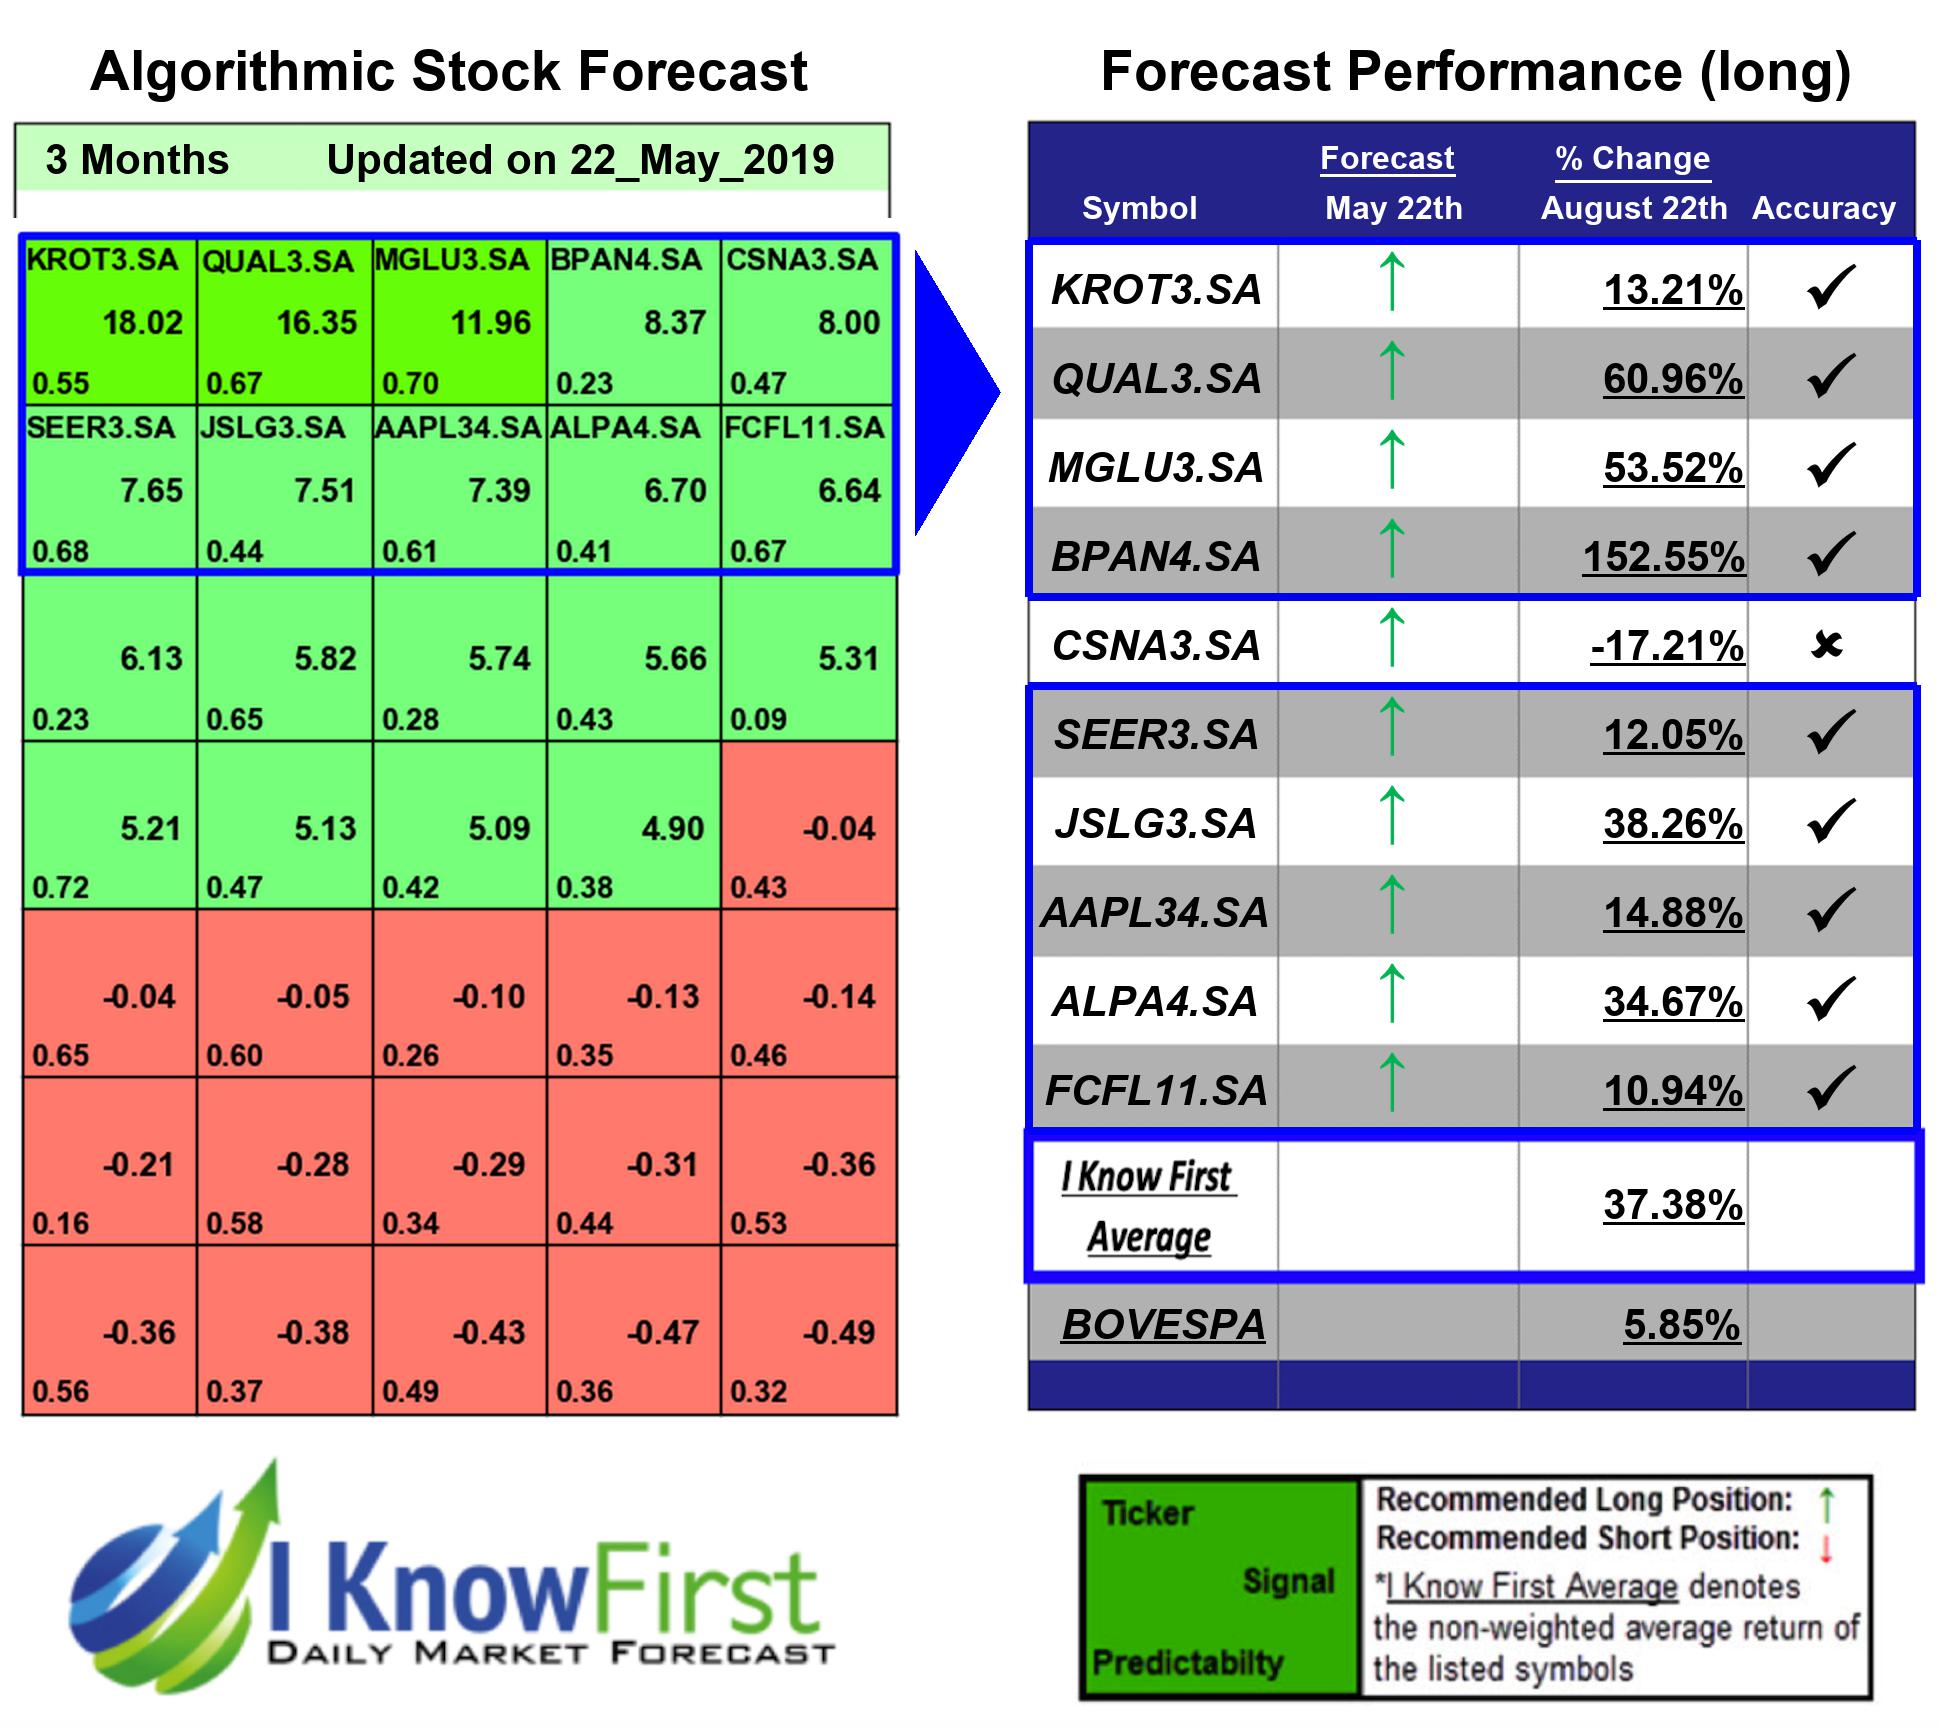

For this 3 Months forecast the algorithm had successfully predicted 9 out of 10 movements. The highest trade return came from BPAN4.SA, at 152.55%. QUAL3.SA, and MGLU3.SA had notable returns of 60.96% and 53.52%. The package had an overall average return of 37.38%, providing investors with a 31.53% premium over the Bovespa’s return of 5.85% during the period.
Banco Pan SA, formerly Banco Panamericano SA, is a Brazil-based commercial bank. The Bank provides a range of financial services and products, including consumer loans, passenger car leasing, and sales financing, among others. The Company operates through five main segments: Financial, which offers consumer credits, credit cards, leasing and investment services; Consortium, which is involved in the management of third party goods, such as cars, motorcycles, electronics and real estate properties; Receivables Securitization; Sales Promoter, and Others. The Company offers its services both to individual and business clients.
Algorithmic traders utilize these daily forecasts by the I Know First market prediction system as a tool to enhance portfolio performance, verify their own analysis and act on market opportunities faster. This forecast was sent to current I Know First subscribers.
How to interpret this diagram
Algorithmic Stock Forecast: The table on the left is a stock forecast produced by I Know First’s algorithm. Each day, subscribers receive forecasts for six different time horizons. Note that the top 10 stocks in the 1-month forecast may be different than those in the 1-year forecast. In the included table, only the relevant stocks have been included. The boxes are arranged according to their respective signal and predictability values (see below for detailed definitions). A green box represents a positive forecast, suggesting a long position, while a red represents a negative forecast, suggesting a short position.
Please note-for trading decisions use the most recent forecast. Get today’s forecast and Top stock picks.