Brazil Stock Market Based on Deep Learning: Returns up to 49.26% in 1 Month
Brazil Stock Market
This Bovespa Stock forecast was generated by the I Know First Algorithm through its analysis of Brazil stock market data and is part of the By Country Package. The full forecast includes daily predictions for a total of 20 stocks with bullish and bearish signals:
- Top 10 Bovespa stocks for the long position
- Top 10 Bovespa stocks for the short position
![]()
![]()
Package Name: Bovespa
Recommended Positions: Long
Forecast Length: 1 Month (1/20/21 – 2/20/21)
I Know First Average: 8.17%

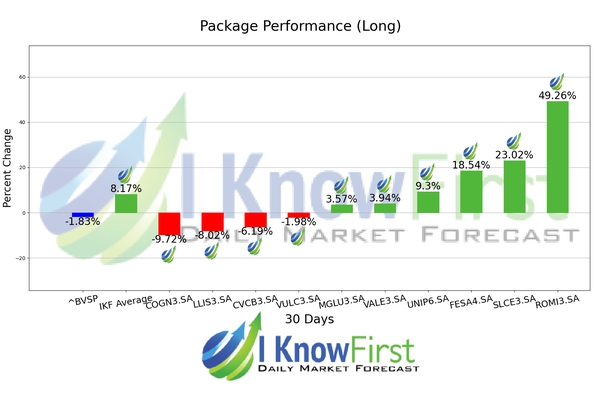
In this 1 Month forecast for the Bovespa Package, there were many high performing trades and the algorithm correctly predicted 6 out 10 trades. ROMI3.SA was the top performing prediction with a return of 49.26%. Other notable stocks were SLCE3.SA and FESA4.SA with a return of 23.02% and 18.54%. The package had an overall average return of 8.17%, providing investors with a 10.00% premium over the Bovespa’s return of -1.83% during the period.
sAdvertising GuidelinesCookiesTerms of UsePrivacyDo Not Sell My Personal InformationAll quotes delayed a minimum of 15 minutes. See here for a complete list of exchanges and delays.© 0 Reuters. All Rights Reserved.
Algorithmic traders utilize these daily forecasts by the I Know First market prediction system as a tool to enhance portfolio performance, verify their own analysis and act on market opportunities faster. This forecast was sent to current I Know First subscribers.
How to interpret this diagram
Algorithmic Stock Forecast: The table on the left is a stock forecast produced by I Know First’s algorithm. Each day, subscribers receive forecasts for six different time horizons. Note that the top 10 stocks in the 1-month forecast may be different than those in the 1-year forecast. In the included table, only the relevant stocks have been included. The boxes are arranged according to their respective signal and predictability values (see below for detailed definitions). A green box represents a positive forecast, suggesting a long position, while a red represents a negative forecast, suggesting a short position.
Please note-for trading decisions use the most recent forecast. Get today’s forecast and Top stock picks.