Brazil Stock Market Based on AI: Returns up to 30.56% in 14 Days
Brazil Stock Market
This Bovespa Stock forecast was generated by the I Know First Algorithm through its analysis of Brazil stock market data and is part of the By Country Package. The full forecast includes daily predictions for a total of 20 stocks with bullish and bearish signals:
- Top 10 Bovespa stocks for the long position
- Top 10 Bovespa stocks for the short position
![]()
![]()
Package Name: Bovespa
Recommended Positions: Long
Forecast Length: 14 Days (6/14/2020 – 6/29/2020)
I Know First Average: 6.9%
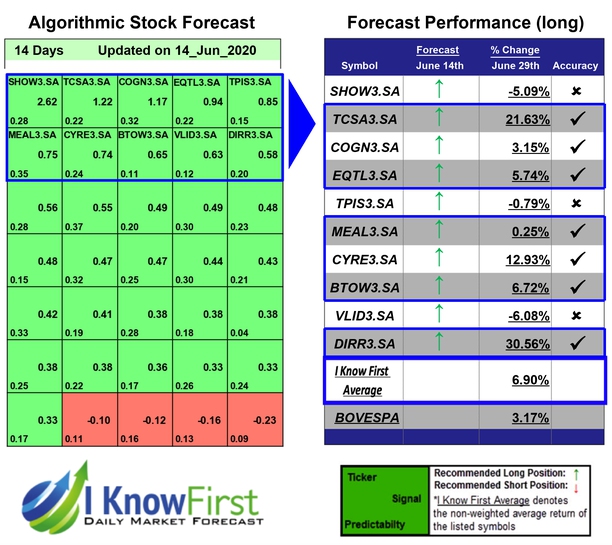

I Know First’s State of the Art Algorithm accurately forecasted 7 out of 10 trades in this Bovespa Package for the 14 Days time period. The greatest return came from DIRR3.SA at 30.56%. TCSA3.SA and CYRE3.SA saw outstanding returns of 21.63% and 12.93%. The package had an overall average return of 6.9%, providing investors with a 3.73% premium over the Bovespa’s return of 3.17% during the period.
Direcional Engenharia S.A. operates as a real estate development and construction company in Brazil. It focuses on the development of residential housing for low income segment primarily in the North and Mid-West regions of Brazil. The company was founded in 1981 and is headquartered in Belo Horizonte, Brazil.
Algorithmic traders utilize these daily forecasts by the I Know First market prediction system as a tool to enhance portfolio performance, verify their own analysis and act on market opportunities faster. This forecast was sent to current I Know First subscribers.
How to interpret this diagram
Algorithmic Stock Forecast: The table on the left is a stock forecast produced by I Know First’s algorithm. Each day, subscribers receive forecasts for six different time horizons. Note that the top 10 stocks in the 1-month forecast may be different than those in the 1-year forecast. In the included table, only the relevant stocks have been included. The boxes are arranged according to their respective signal and predictability values (see below for detailed definitions). A green box represents a positive forecast, suggesting a long position, while a red represents a negative forecast, suggesting a short position.
Please note-for trading decisions use the most recent forecast. Get today’s forecast and Top stock picks.