
Biotech Stocks Based on Machine Learning: Returns up to 39.16% in 7 Days
Biotech Stocks
The BioTech Stocks Package is designed for investors and analysts who need predictions of the best stocks to buy for the whole Biotechnology Industry. It includes 20 stocks with bullish and bearish signals and indicates the best biotech stocks to trade:
- Top 10 Biotech stocks for the long position
- Top 10 Biotech stocks for the short position

Package Name: Biotech Stocks Forecast
Recommended Positions: Long & Short
Forecast Length: 7 Days (10/14/2020 – 10/21/2020)
I Know First Average: 4.65% (Long) & 7.55% (Short)

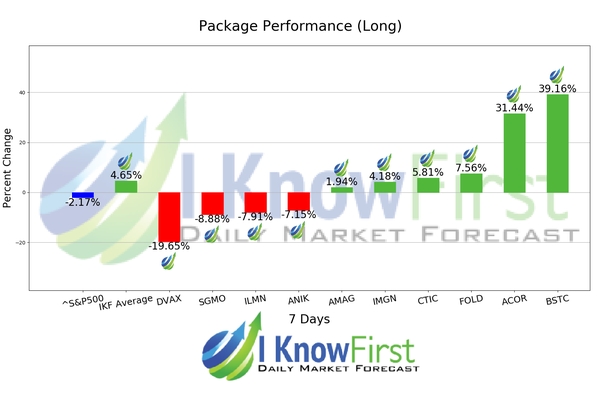
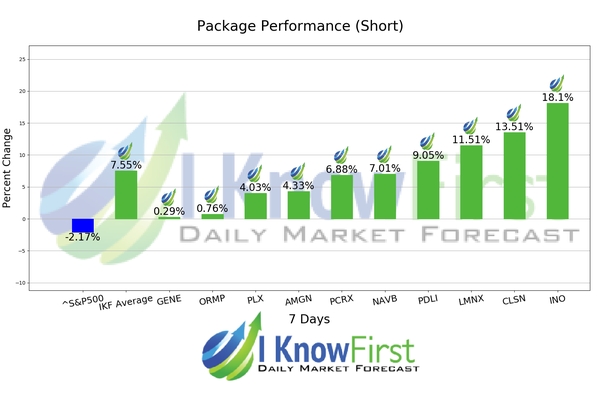
During the 7 Days forecast, the algorithm had predicted high returns for those seeking stock advice. The best performance in the short position came from GENE which registered a return of 0.29%. For the long positions the largest growth was registered by BSTC with a return of 39.16%, during the same period. The package itself, had an overall average return of 4.65%, in the long position, providing a premium of 6.82% over the SP500’s return of -2.17%. With regards to the short position, the package had an overall average return of 7.55%, providing investors with a premium of 9.72% over S&P500’s return of -2.17%. The I Know First’s Stock Market Algorithm accurately forecasted 6 out of 10 stocks, for the long position, and 10 out of 10 stocks, for the short position for this 7 Days forecasted period.
Algorithmic traders utilize these daily forecasts by the I Know First market prediction system as a tool to enhance portfolio performance, verify their own analysis and act on market opportunities faster. This forecast was sent to current I Know First subscribers.
How to interpret this diagram
How to interpret this diagram:
Algorithmic Stock Forecast: The table on the left is a stock forecast produced by I Know First’s algorithm. Each day, subscribers receive forecasts for six different time horizons. Note that the top 10 stocks in the 1-month forecast may be different than those in the 1-year forecast. In the included table, only the relevant stocks have been included. The boxes are arranged according to their respective signal and predictability values (see below for detailed definitions). A green box represents a positive forecast, suggesting a long position, while a red represents a negative forecast, suggesting a short position.
Please note-for trading decisions use the most recent forecast. Get today’s forecast and Top stock picks.


