
Biotech Stocks Based on Data Mining: Returns up to 151.17% in 3 Months
Biotech Stocks
The BioTech Stocks Package is designed for investors and analysts who need predictions of the best stocks to buy for the whole Biotechnology Industry. It includes 20 stocks with bullish and bearish signals and indicates the best biotech stocks to trade:
- Top 10 Biotech stocks for the long position
- Top 10 Biotech stocks for the short position

Package Name: Biotech Stocks Forecast
Recommended Positions: Long
Forecast Length: 3 Months (5/3/2020 – 8/3/2020)
I Know First Average: 29.17%
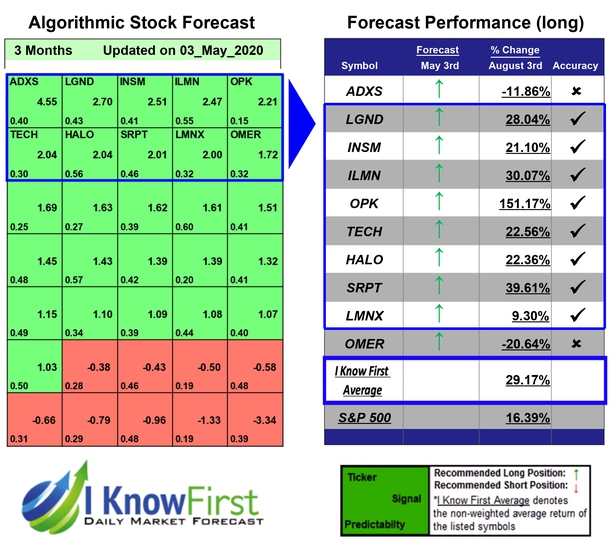
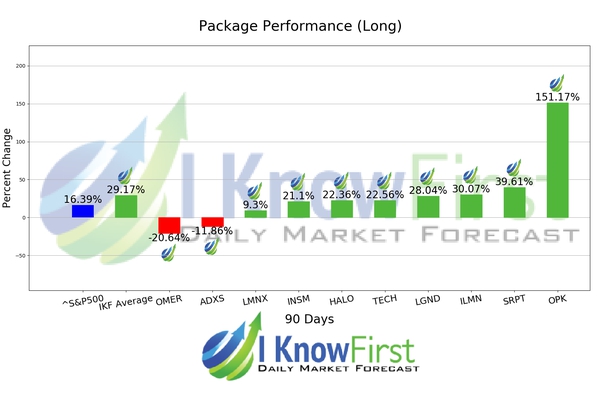
I Know First’s State of the Art Algorithm accurately forecasted 8 out of 10 trades in this Biotech Stocks Forecast Package for the 3 Months time period. The highest trade return came from OPK, at 151.17%. The suggested trades for SRPT and ILMN also had notable 3 Months yields of 39.61% and 30.07%, respectively. The package had an overall average return of 29.17%, providing investors with a premium of 12.78% over the S&P 500’s return of 16.39% during the same period.
OPKO Health, Inc., incorporated on November 18, 1991, is a diversified healthcare company. The Company’s segments include Pharmaceutical, Diagnostics and Corporate. The pharmaceutical segment consists of the pharmaceutical operations in Chile, Mexico, Ireland, Israel and Spain and its pharmaceutical research and development operations. The diagnostics segment primarily consists of the clinical laboratory operations in Bio-Reference Laboratories (Bio-Reference) and its point-of-care operations.
Algorithmic traders utilize these daily forecasts by the I Know First market prediction system as a tool to enhance portfolio performance, verify their own analysis and act on market opportunities faster. This forecast was sent to current I Know First subscribers.
How to interpret this diagram
Algorithmic Stock Forecast: The table on the left is a stock forecast produced by I Know First’s algorithm. Each day, subscribers receive forecasts for six different time horizons. Note that the top 10 stocks in the 1-month forecast may be different than those in the 1-year forecast. In the included table, only the relevant stocks have been included. The boxes are arranged according to their respective signal and predictability values (see below for detailed definitions). A green box represents a positive forecast, suggesting a long position, while a red represents a negative forecast, suggesting a short position.
Please note-for trading decisions use the most recent forecast. Get today’s forecast and Top stock picks.


