
Best Technology Stocks Based on Machine Learning: Returns up to 38.95% in 3 Months
Best Technology Stocks
This Tech Stock forecast is based on stock picking strategies for investors and analysts who need predictions for the 10 best tech stocks in the Technology Industry (see Tech Stocks Package). It includes 20 stocks with bullish and bearish signals:
- Top 10 Tech stocks for the long position
- Top 10 Tech stocks for the short position
Package Name: Tech Stocks Forecast
Recommended Positions: Long
Forecast Length: 3 Months (10/22/2019 – 1/22/2020)
I Know First Average: 23.37%
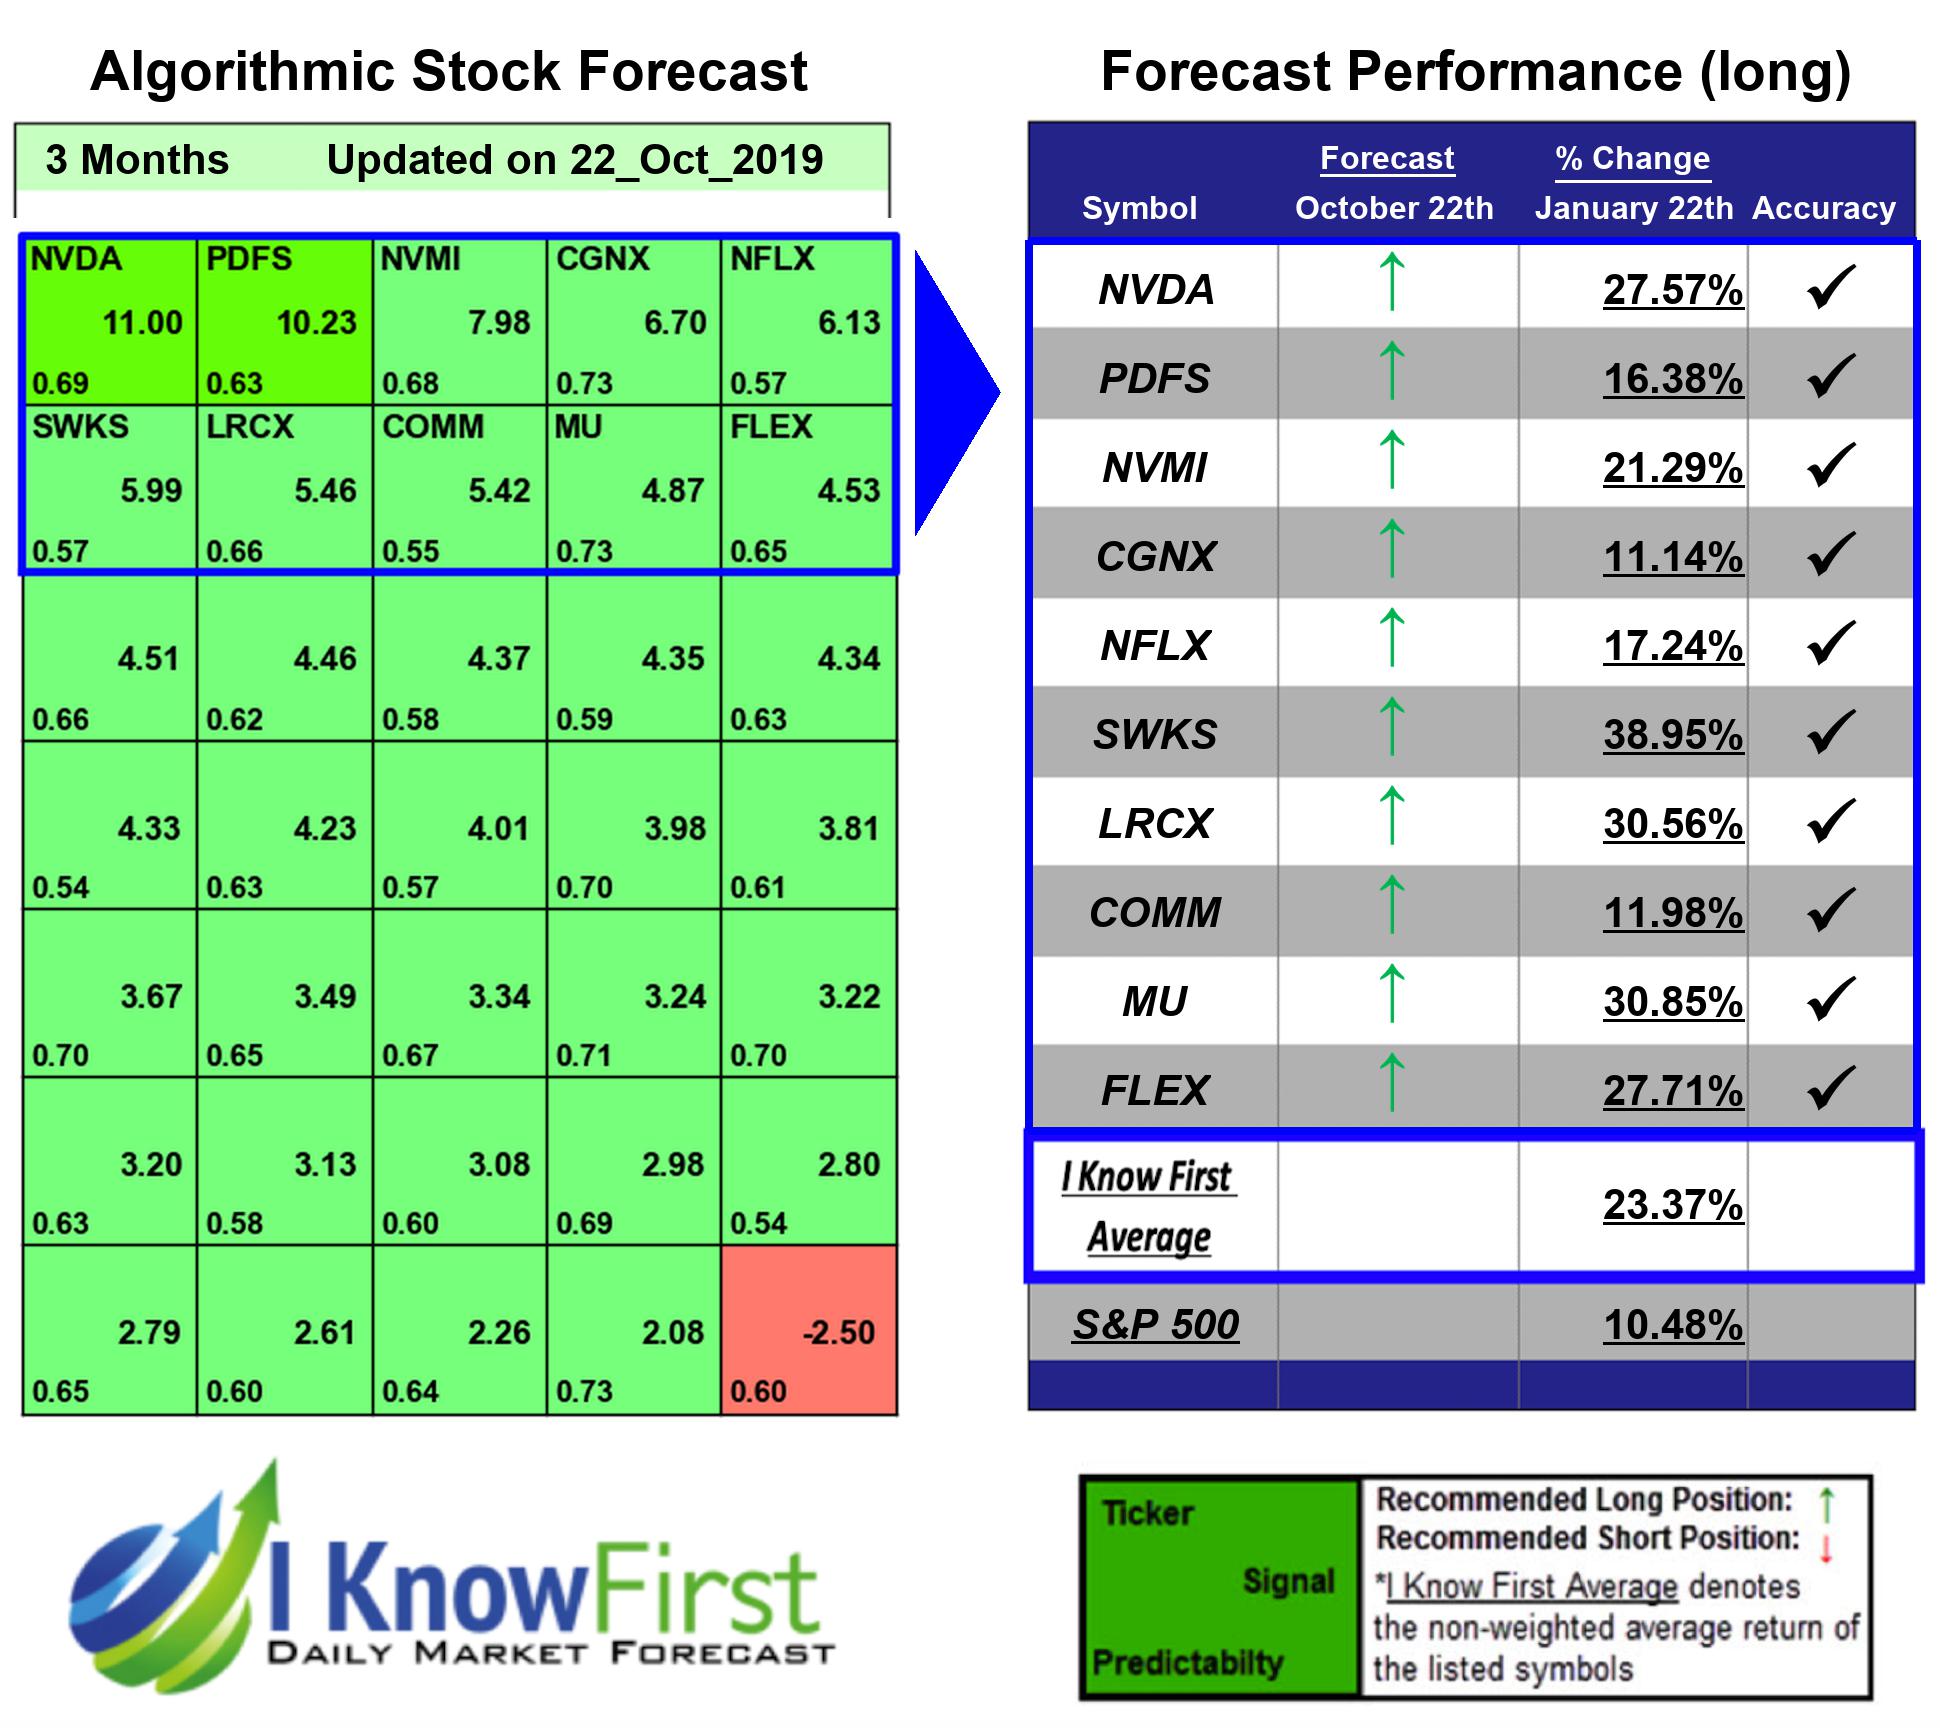
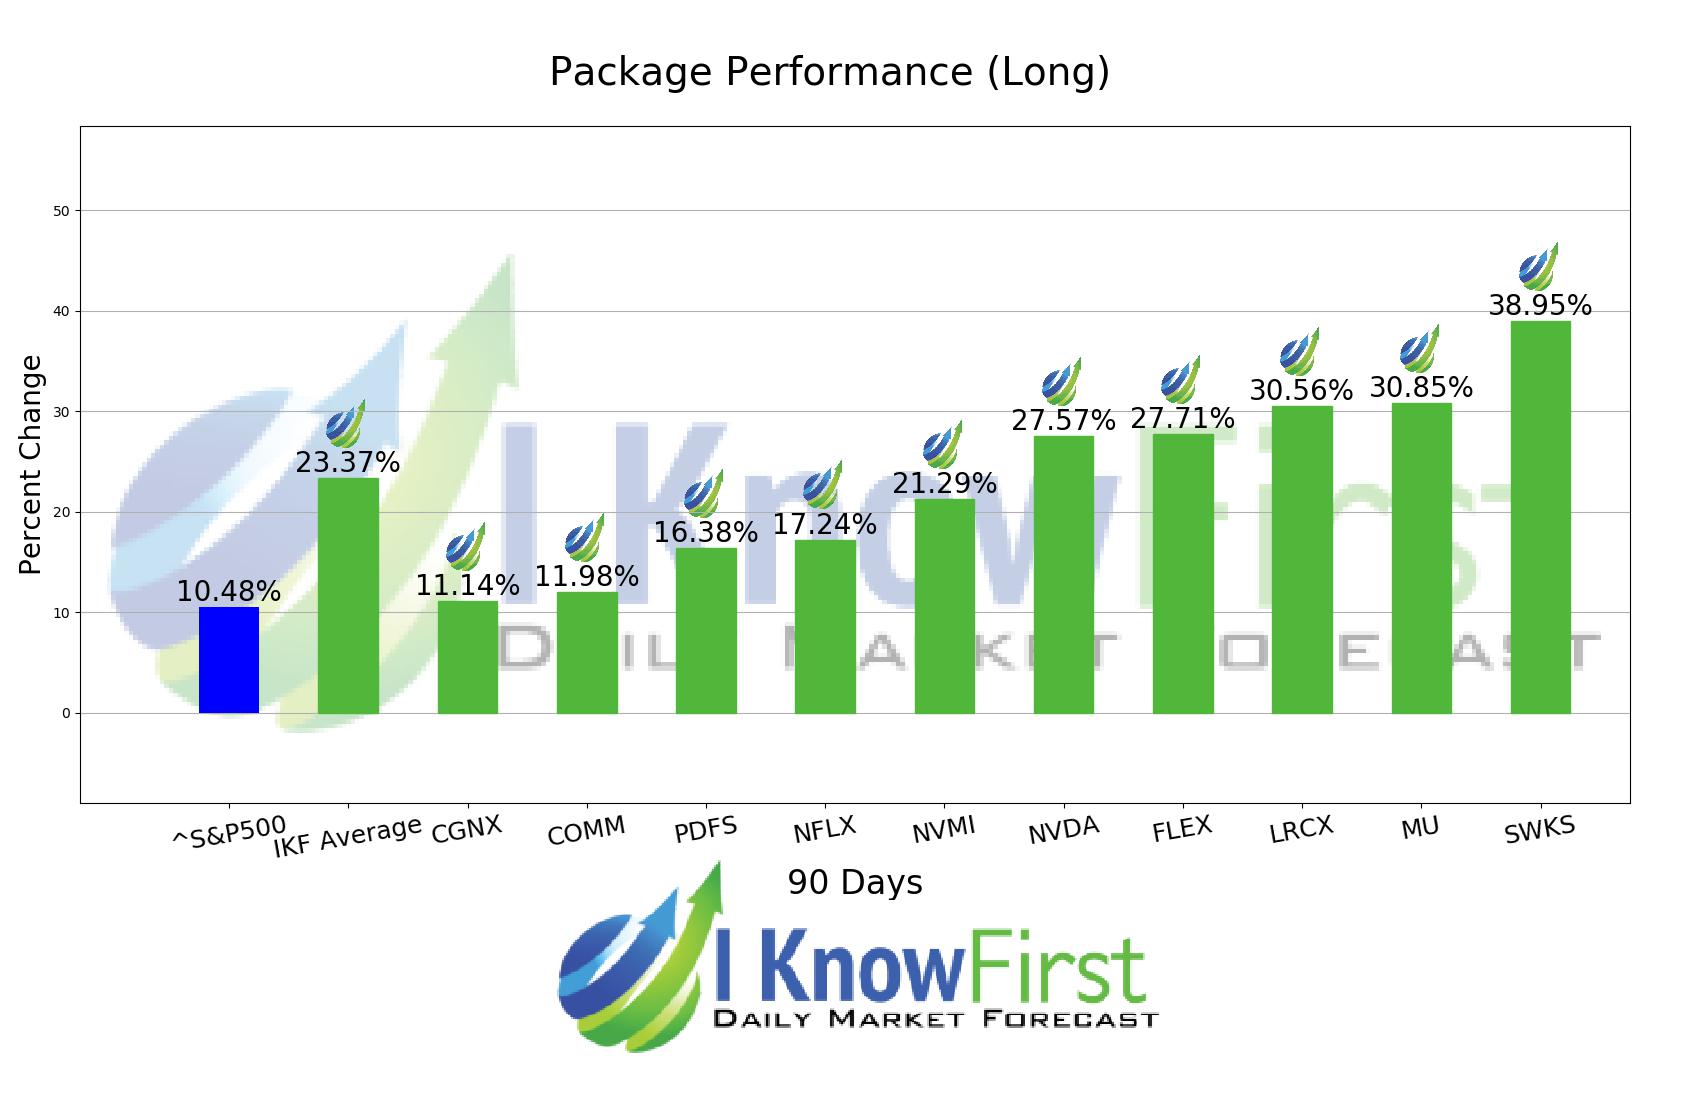
In this 3 Months forecast for the Tech Stocks Forecast Package, there were many high performing trades and the algorithm correctly predicted 10 out 10 trades. The prediction with the highest return was SWKS, at 38.95%. Additional high returns came from MU and LRCX, at 30.85% and 30.56% respectively. The package had an overall average return of 23.37%, providing investors with a 12.89% premium over the S&P 500’s return of 10.48% during the period.
Skyworks Solutions, Inc. (SWKS), together with its subsidiaries, designs, develops, manufactures, and markets proprietary semiconductor products, including intellectual property worldwide.
Algorithmic traders utilize these daily forecasts by the I Know First market prediction system as a tool to enhance portfolio performance, verify their own analysis and act on market opportunities faster. This forecast was sent to current I Know First subscribers.
How to interpret this diagram
Algorithmic Stock Forecast: The table on the left is a stock forecast produced by I Know First’s algorithm. Each day, subscribers receive forecasts for six different time horizons. Note that the top 10 stocks in the 1-month forecast may be different than those in the 1-year forecast. In the included table, only the relevant stocks have been included. The boxes are arranged according to their respective signal and predictability values (see below for detailed definitions). A green box represents a positive forecast, suggesting a long position, while a red represents a negative forecast, suggesting a short position.
Please note-for trading decisions use the most recent forecast. Get today’s forecast and Top stock picks.


