
Best Tech Stocks Based on Algorithmic Trading: Returns up to 18.18% in 14 Days
Best Tech Stocks
This Tech Stock forecast is based on stock picking strategies for investors and analysts who need predictions for the 10 best tech stocks in the Technology Industry (see Tech Stocks Package). It includes 20 stocks with bullish and bearish signals:
- Top 10 Tech stocks for the long position
- Top 10 Tech stocks for the short position
Package Name: Tech Stocks Forecast
Recommended Positions: Long
Forecast Length: 14 Days (4/22/2020 – 5/6/2020)
I Know First Average: 12.28%
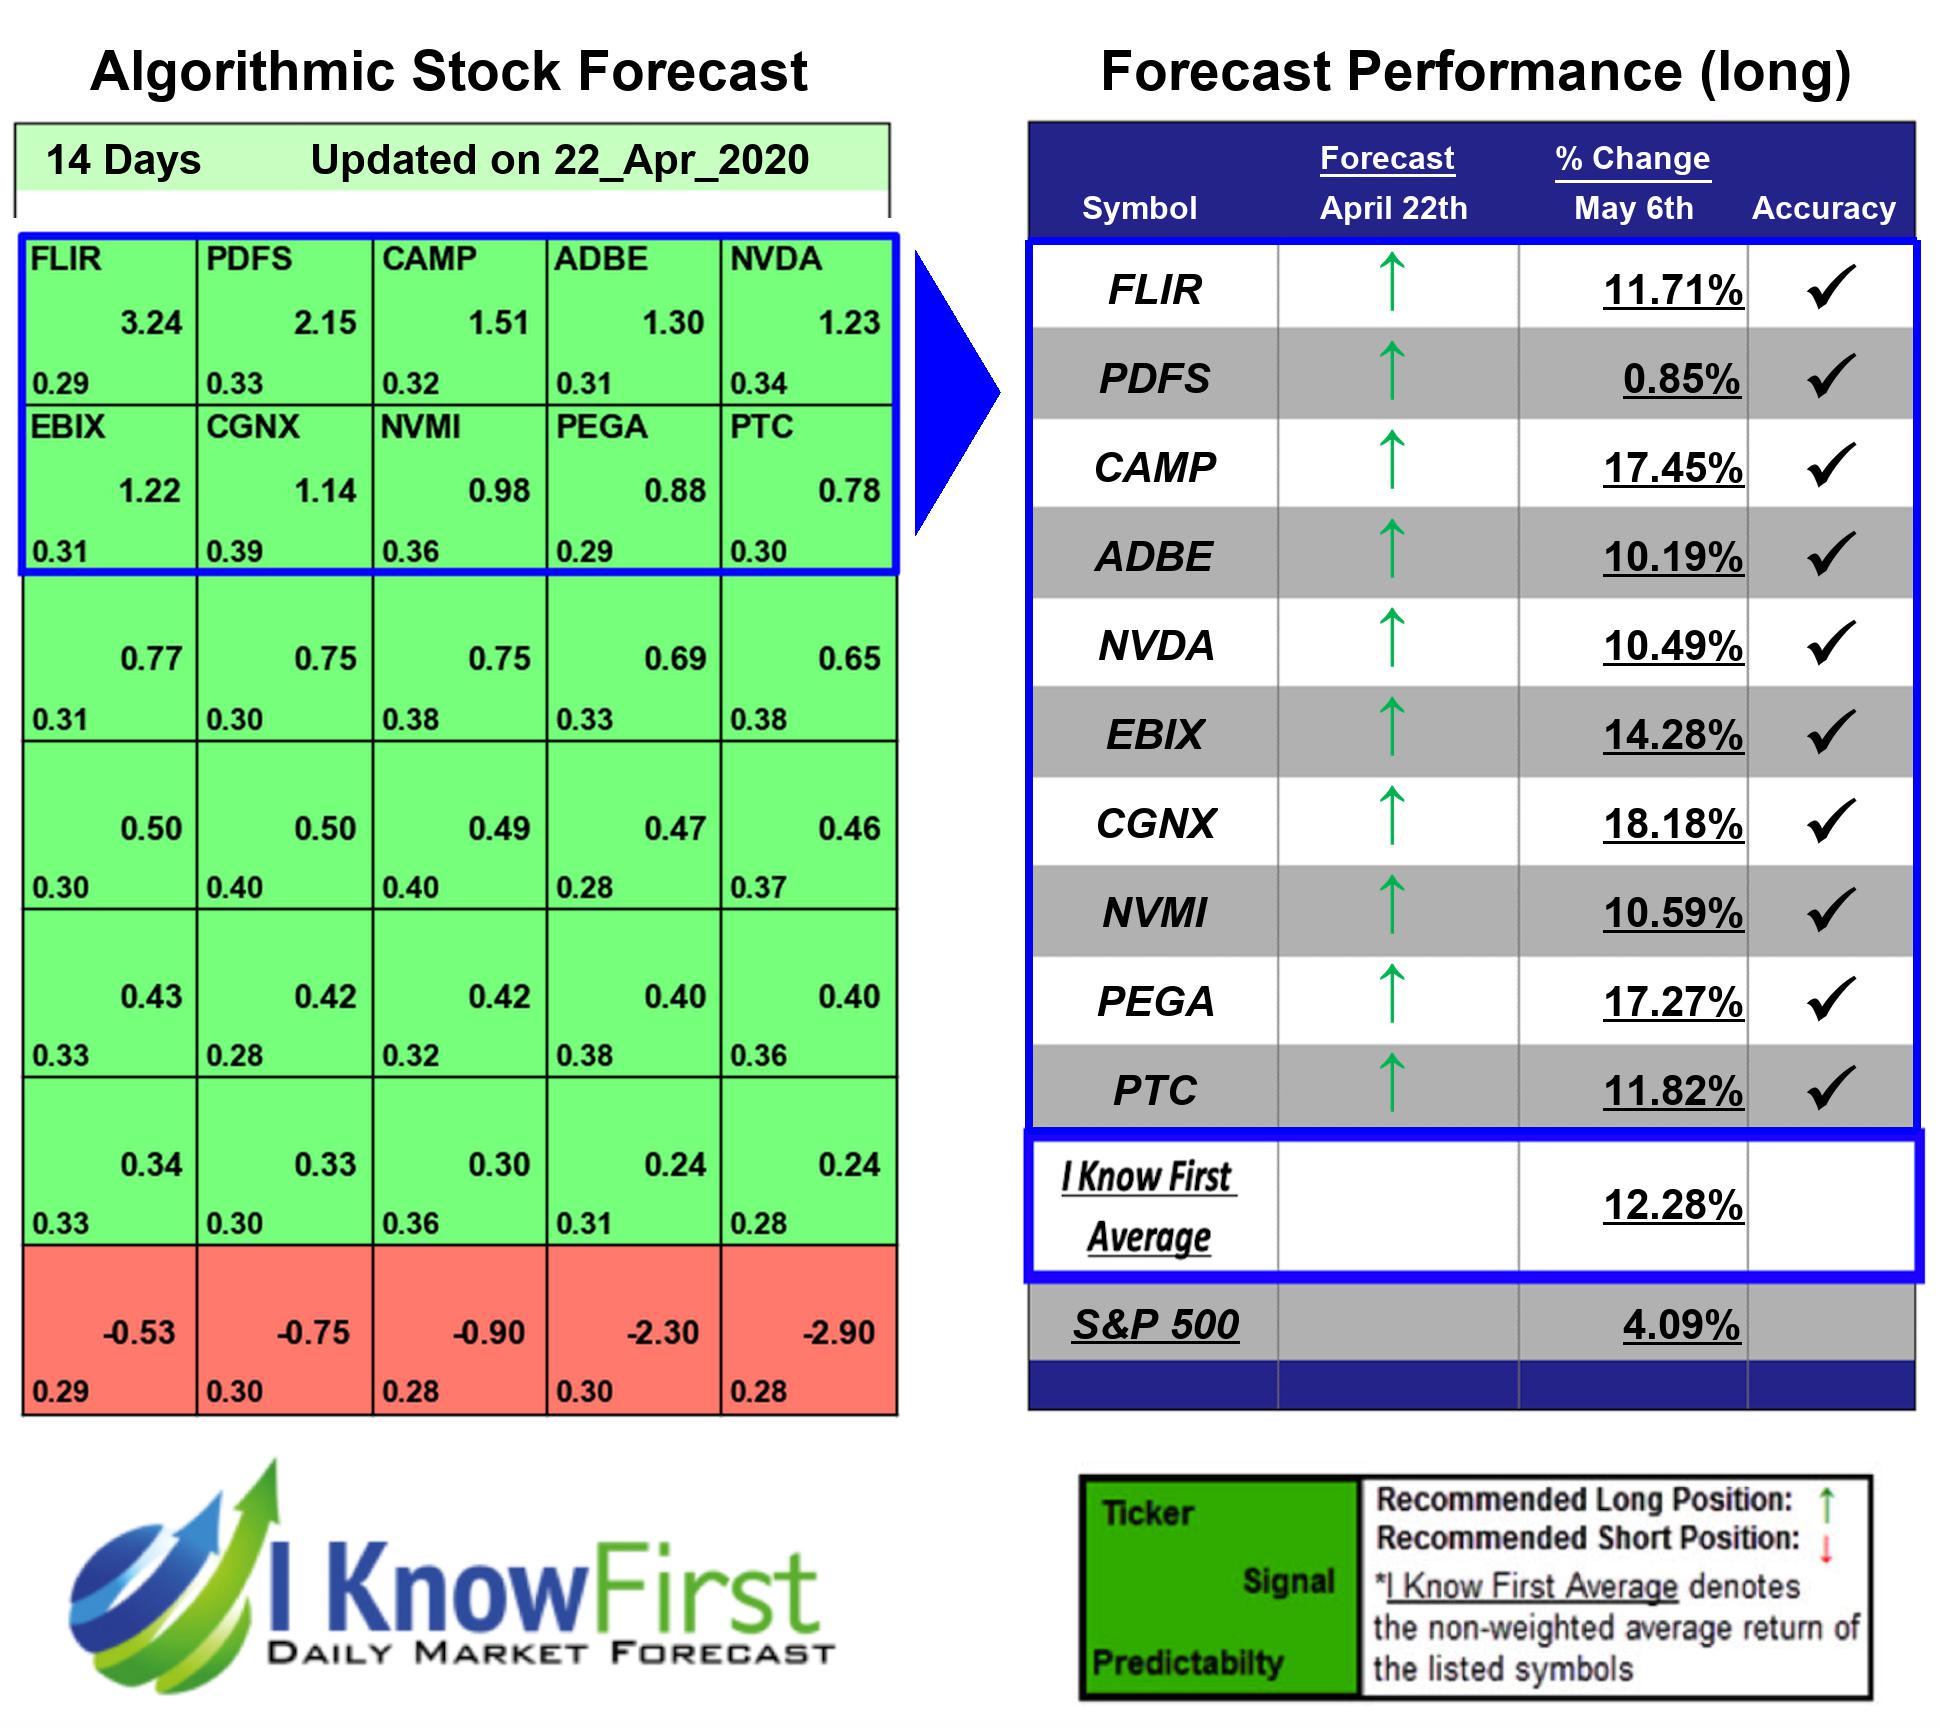
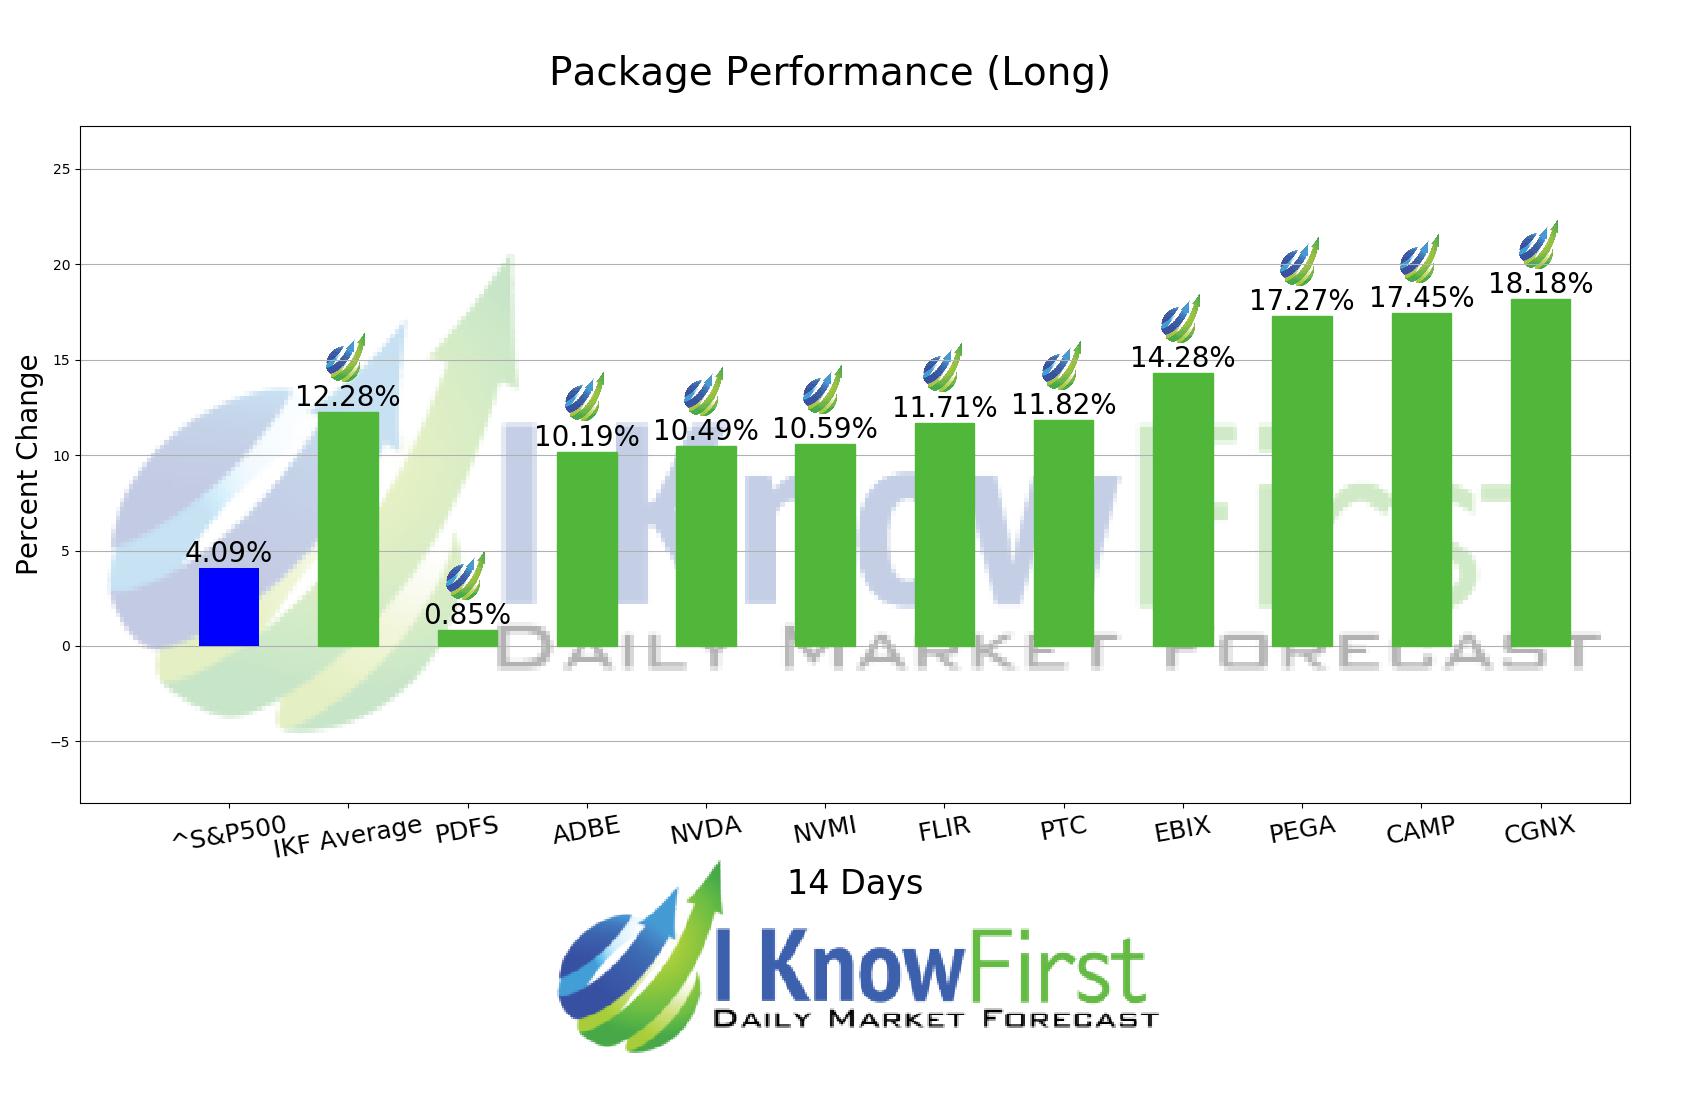
10 out of 10 stock prices in this forecast for the Tech Stocks Forecast Package moved as predicted by the algorithm. CGNX was our best stock pick this week a return of 18.18%. CAMP and PEGA saw outstanding returns of 17.45% and 17.27%. The package saw an overall yield of 12.28% versus the S&P 500’s return of 4.09% implying a market premium of 8.19%.
Cognex Corporation (Cognex), incorporated on January 7, 1981, is a provider of machine vision products that capture and analyze visual information in order to automate tasks, primarily in manufacturing processes, where vision is required. The Company operates through the machine vision technology segment. The Company’s machine vision products are used to automate the manufacture and tracking of discrete items, such as mobile phones, aspirin bottles and automobile tires, by locating, identifying, inspecting and measuring them during the manufacturing or distribution process. The Company’s products include vision software, vision systems, vision sensors and identification (ID) products. Its products range from vision sensors that are integrated, to personal computer (PC)-based systems for users. Its products also have a range of physical forms, depending upon the user’s need. Cognex sells its products through a direct sales force, as well as through a global network of integration and distribution partners.
Algorithmic traders utilize these daily forecasts by the I Know First market prediction system as a tool to enhance portfolio performance, verify their own analysis and act on market opportunities faster. This forecast was sent to current I Know First subscribers.
How to interpret this diagram
Algorithmic Stock Forecast: The table on the left is a stock forecast produced by I Know First’s algorithm. Each day, subscribers receive forecasts for six different time horizons. Note that the top 10 stocks in the 1-month forecast may be different than those in the 1-year forecast. In the included table, only the relevant stocks have been included. The boxes are arranged according to their respective signal and predictability values (see below for detailed definitions). A green box represents a positive forecast, suggesting a long position, while a red represents a negative forecast, suggesting a short position.
Please note-for trading decisions use the most recent forecast. Get today’s forecast and Top stock picks.


