
Best Stocks Under 50 Based on AI: Returns up to 148.23% in 3 Months
Best Stocks Under 50
This forecast is part of the Stocks Under 50 Dollars Package, as one of I Know First’s forecast services. The full package includes daily stock predictions for a total of 20 Best Stocks Under 50 stocks with bullish and bearish signals:
- Top 10 stocks for the long position
- Top 10 stocks for the short position
Package Name: Stocks Under $50
Recommended Positions: Long
Forecast Length: 3 Months (3/18/2020 – 6/18/2020)
I Know First Average: 41.01%
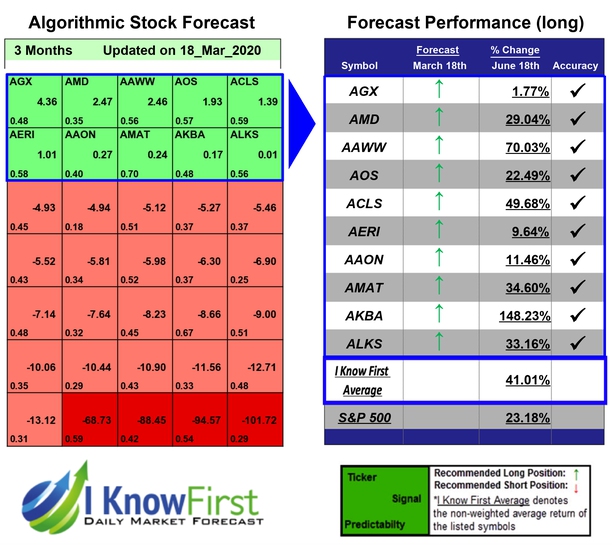
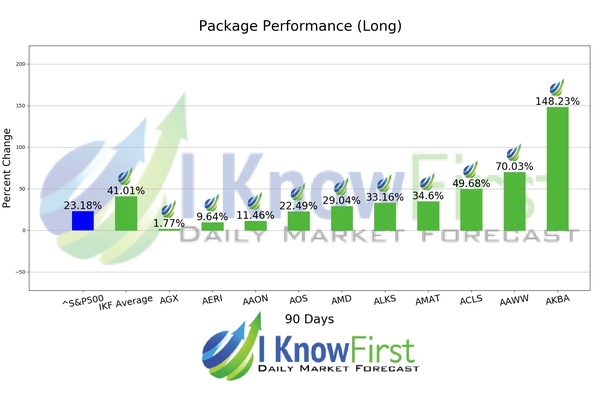
I Know First’s State of the Art Algorithm accurately forecasted 10 out of 10 trades in this Stocks Under $50 Package for the 3 Months time period. AKBA was the highest-earning trade with a return of 148.23% in 3 Months. Additional high returns came from AAWW and ACLS, at 70.03% and 49.68% respectively. With these notable trade returns, the package itself registered an average return of 41.01% compared to the S&P 500’s return of 23.18% for the same period.
Akebia Therapeutics, Inc., incorporated on February 27, 2007, is a biopharmaceutical company. The Company focuses on the development and commercialization of therapeutics based on hypoxia-inducible factor (HIF) biology. The Company’s lead product candidate, vadadustat, is indicated for the treatment of anemia in chronic kidney disease (CKD). It is involved in developing vadadustat as an oral therapy. The Company’s vadadustat is a HIF-prolyl-hydroxylase (HIF-PH) inhibitor in Phase III development for the treatment of anemia of CKD.
Algorithmic traders utilize these daily forecasts by the I Know First market prediction system as a tool to enhance portfolio performance, verify their own analysis and act on market opportunities faster. This forecast was sent to current I Know First subscribers.
How to interpret this diagram
Algorithmic Stock Forecast: The table on the left is a stock forecast produced by I Know First’s algorithm. Each day, subscribers receive forecasts for six different time horizons. Note that the top 10 stocks in the 1-month forecast may be different than those in the 1-year forecast. In the included table, only the relevant stocks have been included. The boxes are arranged according to their respective signal and predictability values (see below for detailed definitions). A green box represents a positive forecast, suggesting a long position, while a red represents a negative forecast, suggesting a short position.
Please note-for trading decisions use the most recent forecast. Get today’s forecast and Top stock picks.


