
Best Stocks Under 5 Based on Genetic Algorithms: Returns up to 50.38% in 3 Months
Best Stocks Under 5
This stock forecast is part of the Stocks Under 5 Dollars Package, as one of I Know First’s algorithmic trading tools. The full package includes daily predictions for a total of 20 Best Stocks Under 5 with bullish and bearish signals:
- Top 10 stocks for the long position
- Top 10 stocks for the short position
![]()
![]()
Package Name: Stocks Under $5
Recommended Positions: Long
Forecast Length: 3 Months (3/28/21 – 6/29/21)
I Know First Average: 25.05%

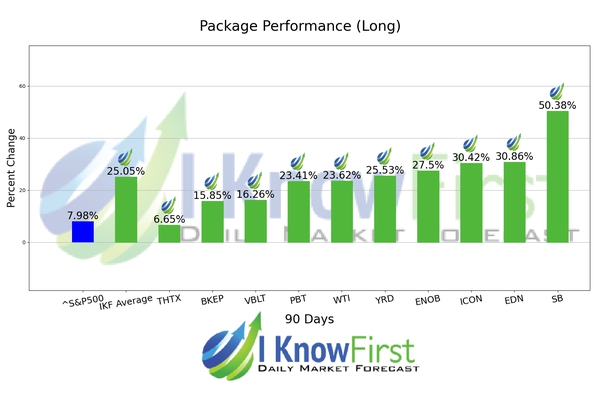
10 out of 10 stock prices in this forecast for the Stocks Under $5 Package moved as predicted by the algorithm. The greatest return came from SB at 50.38%. EDN and ICON saw outstanding returns of 30.86% and 30.42%. With these notable trade returns, the package itself registered an average return of 25.05% compared to the S&P 500’s return of 7.98% for the same period.
Safe Bulkers, Inc (SB). provides marine drybulk transportation services worldwide. It is involved in the acquisition, ownership, and operation of dry bulk vessels for transporting bulk cargoes, primarily coal, grain, and iron ore. As of February 5, 2016, the company had a fleet of 37 drybulk vessels with an aggregate carrying capacity of 3.3 million deadweight tons. Its fleet consists of 14 Panamax class vessels, 8 Kamsarmax class vessels, 12 Post-Panamax class vessels, and 3 Capesize class vessels. Safe Bulkers, Inc (SB). was founded in 2007 and is based in Monaco.
Algorithmic traders utilize these daily forecasts by the I Know First market prediction system as a tool to enhance portfolio performance, verify their own analysis and act on market opportunities faster. This forecast was sent to current I Know First subscribers.
How to interpret this diagram
Algorithmic Stock Forecast: The table on the left is a stock forecast produced by I Know First’s algorithm. Each day, subscribers receive forecasts for six different time horizons. Note that the top 10 stocks in the 1-month forecast may be different than those in the 1-year forecast. In the included table, only the relevant stocks have been included. The boxes are arranged according to their respective signal and predictability values (see below for detailed definitions). A green box represents a positive forecast, suggesting a long position, while a red represents a negative forecast, suggesting a short position.
Please note-for trading decisions use the most recent forecast. Get today’s forecast and Top stock picks.


