
Best Stocks Under 10 Based on Pattern Recognition: Returns up to 35.31% in 7 Days
Best Stocks Under 10
This forecast is part of the Stocks Under 10 Dollars Package, as one of I Know First’s forecast services. The full package includes daily stock predictions for a total of 20 Best Stocks Under 10 stocks with bullish and bearish signals:
- Top 10 stocks for the long position
- Top 10 stocks for the short position

Package Name: Stocks Under $10
Recommended Positions: Long
Forecast Length: 7 Days (11/17/2020 – 11/24/2020)
I Know First Average: 15.81%
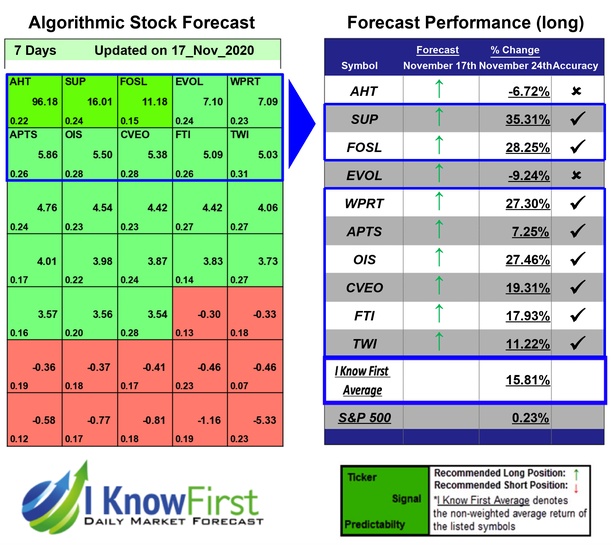
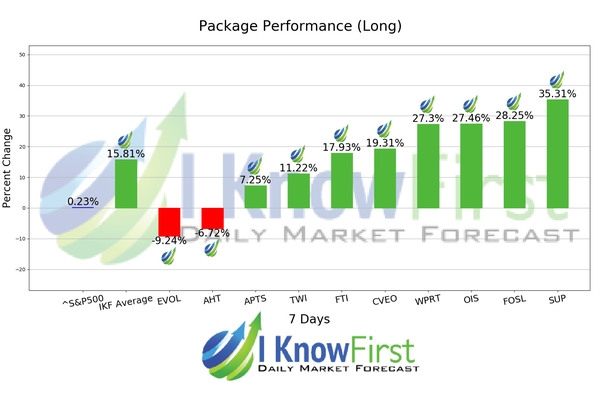
For this 7 Days forecast the algorithm had successfully predicted 8 out of 10 movements. SUP was the highest-earning trade with a return of 35.31% in 7 Days. The suggested trades for FOSL and OIS also had notable 7 Days yields of 28.25% and 27.46%, respectively. The Stocks Under $10 package had an overall average return of 15.81%, providing investors with a premium of 15.58% over the S&P 500’s return of 0.23%.
Superior Industries International, Inc. (SUP) designs, manufactures, and sells aluminum wheels to the original equipment manufacturers in North America. It supplies cast aluminum wheels to the automobile and light truck manufacturers. The company was founded in 1957 and is headquartered in Southfield, Michigan.
Algorithmic traders utilize these daily forecasts by the I Know First market prediction system as a tool to enhance portfolio performance, verify their own analysis and act on market opportunities faster. This forecast was sent to current I Know First subscribers.
How to interpret this diagram
Algorithmic Stock Forecast: The table on the left is a stock forecast produced by I Know First’s algorithm. Each day, subscribers receive forecasts for six different time horizons. Note that the top 10 stocks in the 1-month forecast may be different than those in the 1-year forecast. In the included table, only the relevant stocks have been included. The boxes are arranged according to their respective signal and predictability values (see below for detailed definitions). A green box represents a positive forecast, suggesting a long position, while a red represents a negative forecast, suggesting a short position.
Please note-for trading decisions use the most recent forecast. Get today’s forecast and Top stock picks.


