
Best Stocks Under 10 Based on AI: Returns up to 20.16% in 3 Days
Best Stocks Under 10
This forecast is part of the Stocks Under 10 Dollars Package, as one of I Know First’s forecast services. The full package includes daily stock predictions for a total of 20 Best Stocks Under 10 stocks with bullish and bearish signals:
- Top 10 stocks for the long position
- Top 10 stocks for the short position

Package Name: Stocks Under $10
Recommended Positions: Long
Forecast Length: 3 Days (12/4/2020 – 12/7/2020)
I Know First Average: 2.56%
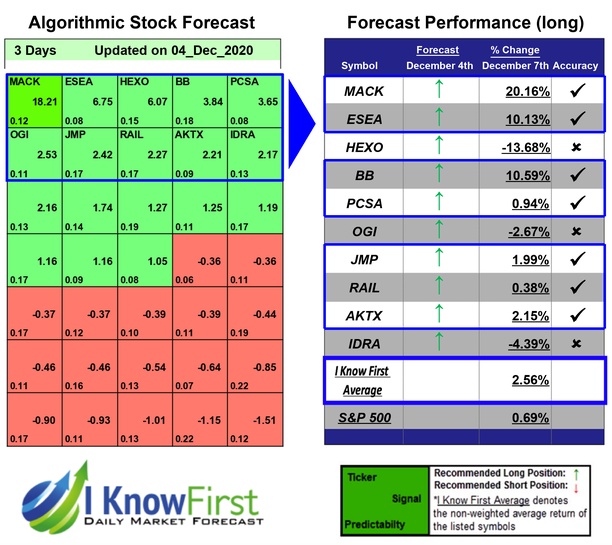
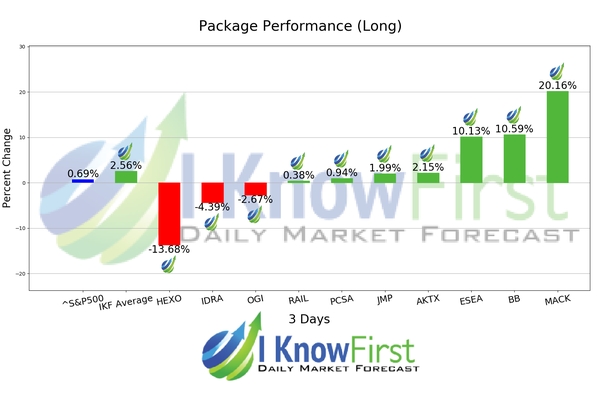
In this 3 Days forecast for the Stocks Under $10 Package, there were many high performing trades and the algorithm correctly predicted 7 out 10 trades. MACK was the highest-earning trade with a return of 20.16% in 3 Days. The suggested trades for BB and ESEA also had notable 3 Days yields of 10.59% and 10.13%, respectively. The overall average return in this Stocks Under $10 package was 2.56%, providing investors with a 1.87% premium over the S&P 500’s return of 0.69% during the same period.
Merrimack Pharmaceuticals, Inc., incorporated on July 6, 2010, is a clinical-stage biopharmaceutical company. The Company is engaged in designing novel treatments for cancer by targeting biomarker-defined cancers. The Company’s development programs include four clinical trials and six candidates in preclinical development. The Company’s clinical programs include MM-121 (seribantumab), MM-141 (istiratumab) and MM-310. The Company’s preclinical programs include MM-161, ATRi, BCL2/BCLxl, TRAIL, Immuno-oncology and STIMULI.
Algorithmic traders utilize these daily forecasts by the I Know First market prediction system as a tool to enhance portfolio performance, verify their own analysis and act on market opportunities faster. This forecast was sent to current I Know First subscribers.
How to interpret this diagram
Algorithmic Stock Forecast: The table on the left is a stock forecast produced by I Know First’s algorithm. Each day, subscribers receive forecasts for six different time horizons. Note that the top 10 stocks in the 1-month forecast may be different than those in the 1-year forecast. In the included table, only the relevant stocks have been included. The boxes are arranged according to their respective signal and predictability values (see below for detailed definitions). A green box represents a positive forecast, suggesting a long position, while a red represents a negative forecast, suggesting a short position.
Please note-for trading decisions use the most recent forecast. Get today’s forecast and Top stock picks.


