
Best Stocks To Buy Based on Big Data Analytics: Returns up to 4.93% in 3 Days
Best Stocks To Buy
This S&P 100 stocks forecast is designed for investors and analysts who need predictions for the best large cap performing stocks in the S&P100 Company Package (see S&P100 Stocks Package). It includes 20 stocks with bullish and bearish signals and indicates the best S&P100 Companies stocks to buy:
- Top 10 S&P100 stocks for the long position
- Top 10 S&P100 stocks for the short position

Package Name: S&P 100 Stocks
Recommended Positions: Long
Forecast Length: 3 Days (10/1/21 – 10/4/21)
I Know First Average: 2.07%
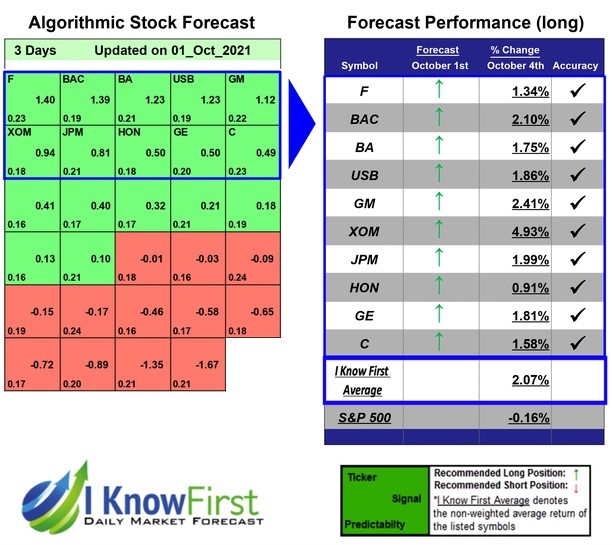

10 out of 10 stock prices in this forecast for the S&P 100 Stocks Package moved as predicted by the algorithm. The greatest return came from XOM at 4.93%. The suggested trades for GM and BAC also had notable 3 Days yields of 2.41% and 2.1%, respectively. The package’s overall average return was 2.07%, providing investors with a 2.23% premium over the S&P 500’s return of -0.16% during the same period.
Exxon Mobil Corporation (XOM) explores for and produces crude oil and natural gas in the United States, Canada/South America, Europe, Africa, Asia, and Australia/Oceania. It also manufactures and markets commodity petrochemicals, including olefins, aromatics, polyethylene and polypropylene plastics, and specialty products; and transports and sells crude oil, natural gas, and petroleum products. Exxon Mobil Corporation (XOM) was founded in 1870 and is headquartered in Irving, Texas.
Algorithmic traders utilize these daily forecasts by the I Know First market prediction system as a tool to enhance portfolio performance, verify their own analysis and act on market opportunities faster. This forecast was sent to current I Know First subscribers.
How to interpret this diagram
Algorithmic Stock Forecast: The table on the left is a stock forecast produced by I Know First’s algorithm. Each day, subscribers receive forecasts for six different time horizons. Note that the top 10 stocks in the 1-month forecast may be different than those in the 1-year forecast. In the included table, only the relevant stocks have been included. The boxes are arranged according to their respective signal and predictability values (see below for detailed definitions). A green box represents a positive forecast, suggesting a long position, while a red represents a negative forecast, suggesting a short position.
Please note-for trading decisions use the most recent forecast. Get today’s forecast and Top stock picks.


