
Best Stocks To Buy Based on Artificial Intelligence: Returns up to 7.56% in 7 Days
Best Stocks To Buy
This S&P 100 stocks forecast is designed for investors and analysts who need predictions for the best large cap performing stocks in the S&P100 Company Package (see S&P100 Stocks Package). It includes 20 stocks with bullish and bearish signals and indicates the best S&P100 Companies stocks to buy:
- Top 10 S&P100 stocks for the long position
- Top 10 S&P100 stocks for the short position

Package Name: S&P 100 Stocks
Recommended Positions: Long
Forecast Length: 7 Days (1/9/22 – 1/16/22)
I Know First Average: 2.82%

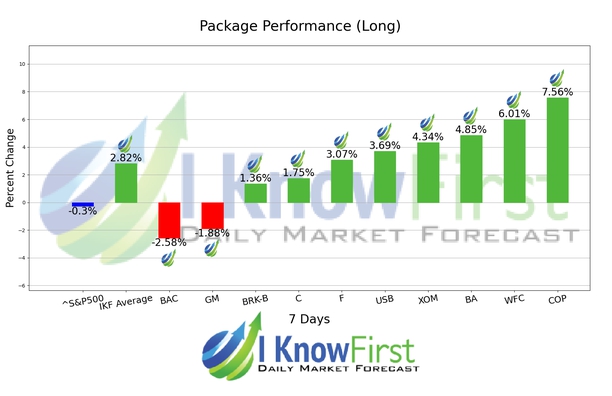
Several predictions in this 7 Days forecast saw significant returns. The algorithm had correctly predicted 8 out of 10 stock movements. COP was our the best stock pick with a return of 7.56%. WFC, and BA had notable returns of 6.01% and 4.85%. The S&P 100 Stocks package had an overall average return of 2.82%, providing investors with a premium of 3.12% over the S&P 500’s return of -0.3%.
ConocoPhillips (COP) explores for, produces, transports, and markets crude oil, bitumen, natural gas, liquefied natural gas, and natural gas liquids worldwide. Its portfolio includes resource-rich North American tight oil and oil sands assets; lower-risk legacy assets in North America, Europe, Asia, and Australia; various international developments; and an inventory of conventional and unconventional exploration prospects. The company was founded in 1917 and is headquartered in Houston, Texas.
Algorithmic traders utilize these daily forecasts by the I Know First market prediction system as a tool to enhance portfolio performance, verify their own analysis and act on market opportunities faster. This forecast was sent to current I Know First subscribers.
How to interpret this diagram
Algorithmic Stock Forecast: The table on the left is a stock forecast produced by I Know First’s algorithm. Each day, subscribers receive forecasts for six different time horizons. Note that the top 10 stocks in the 1-month forecast may be different than those in the 1-year forecast. In the included table, only the relevant stocks have been included. The boxes are arranged according to their respective signal and predictability values (see below for detailed definitions). A green box represents a positive forecast, suggesting a long position, while a red represents a negative forecast, suggesting a short position.
Please note-for trading decisions use the most recent forecast. Get today’s forecast and Top stock picks.


