
Best S&P 500 Stock Picks Based on Predictive Analytics: Returns up to 27.54% in 3 Months
Best S&P 500 Stock Picks
These Best S&P 500 Stock Picks are designed for investors and analysts who need predictions for the whole S&P 500 (See S&P 500 Companies Package). It includes 20 stocks with bullish and bearish signals and indicates the best S&P 500 Companies stocks to buy:
- Top 10 S&P 500 stocks for the long position
- Top 10 S&P 500 stocks for the short position

Package Name: Top S&P 500 Stocks
Recommended Positions: Long
Forecast Length: 3 Months (12/1/2019 – 3/2/2020)
I Know First Average: 3.51%
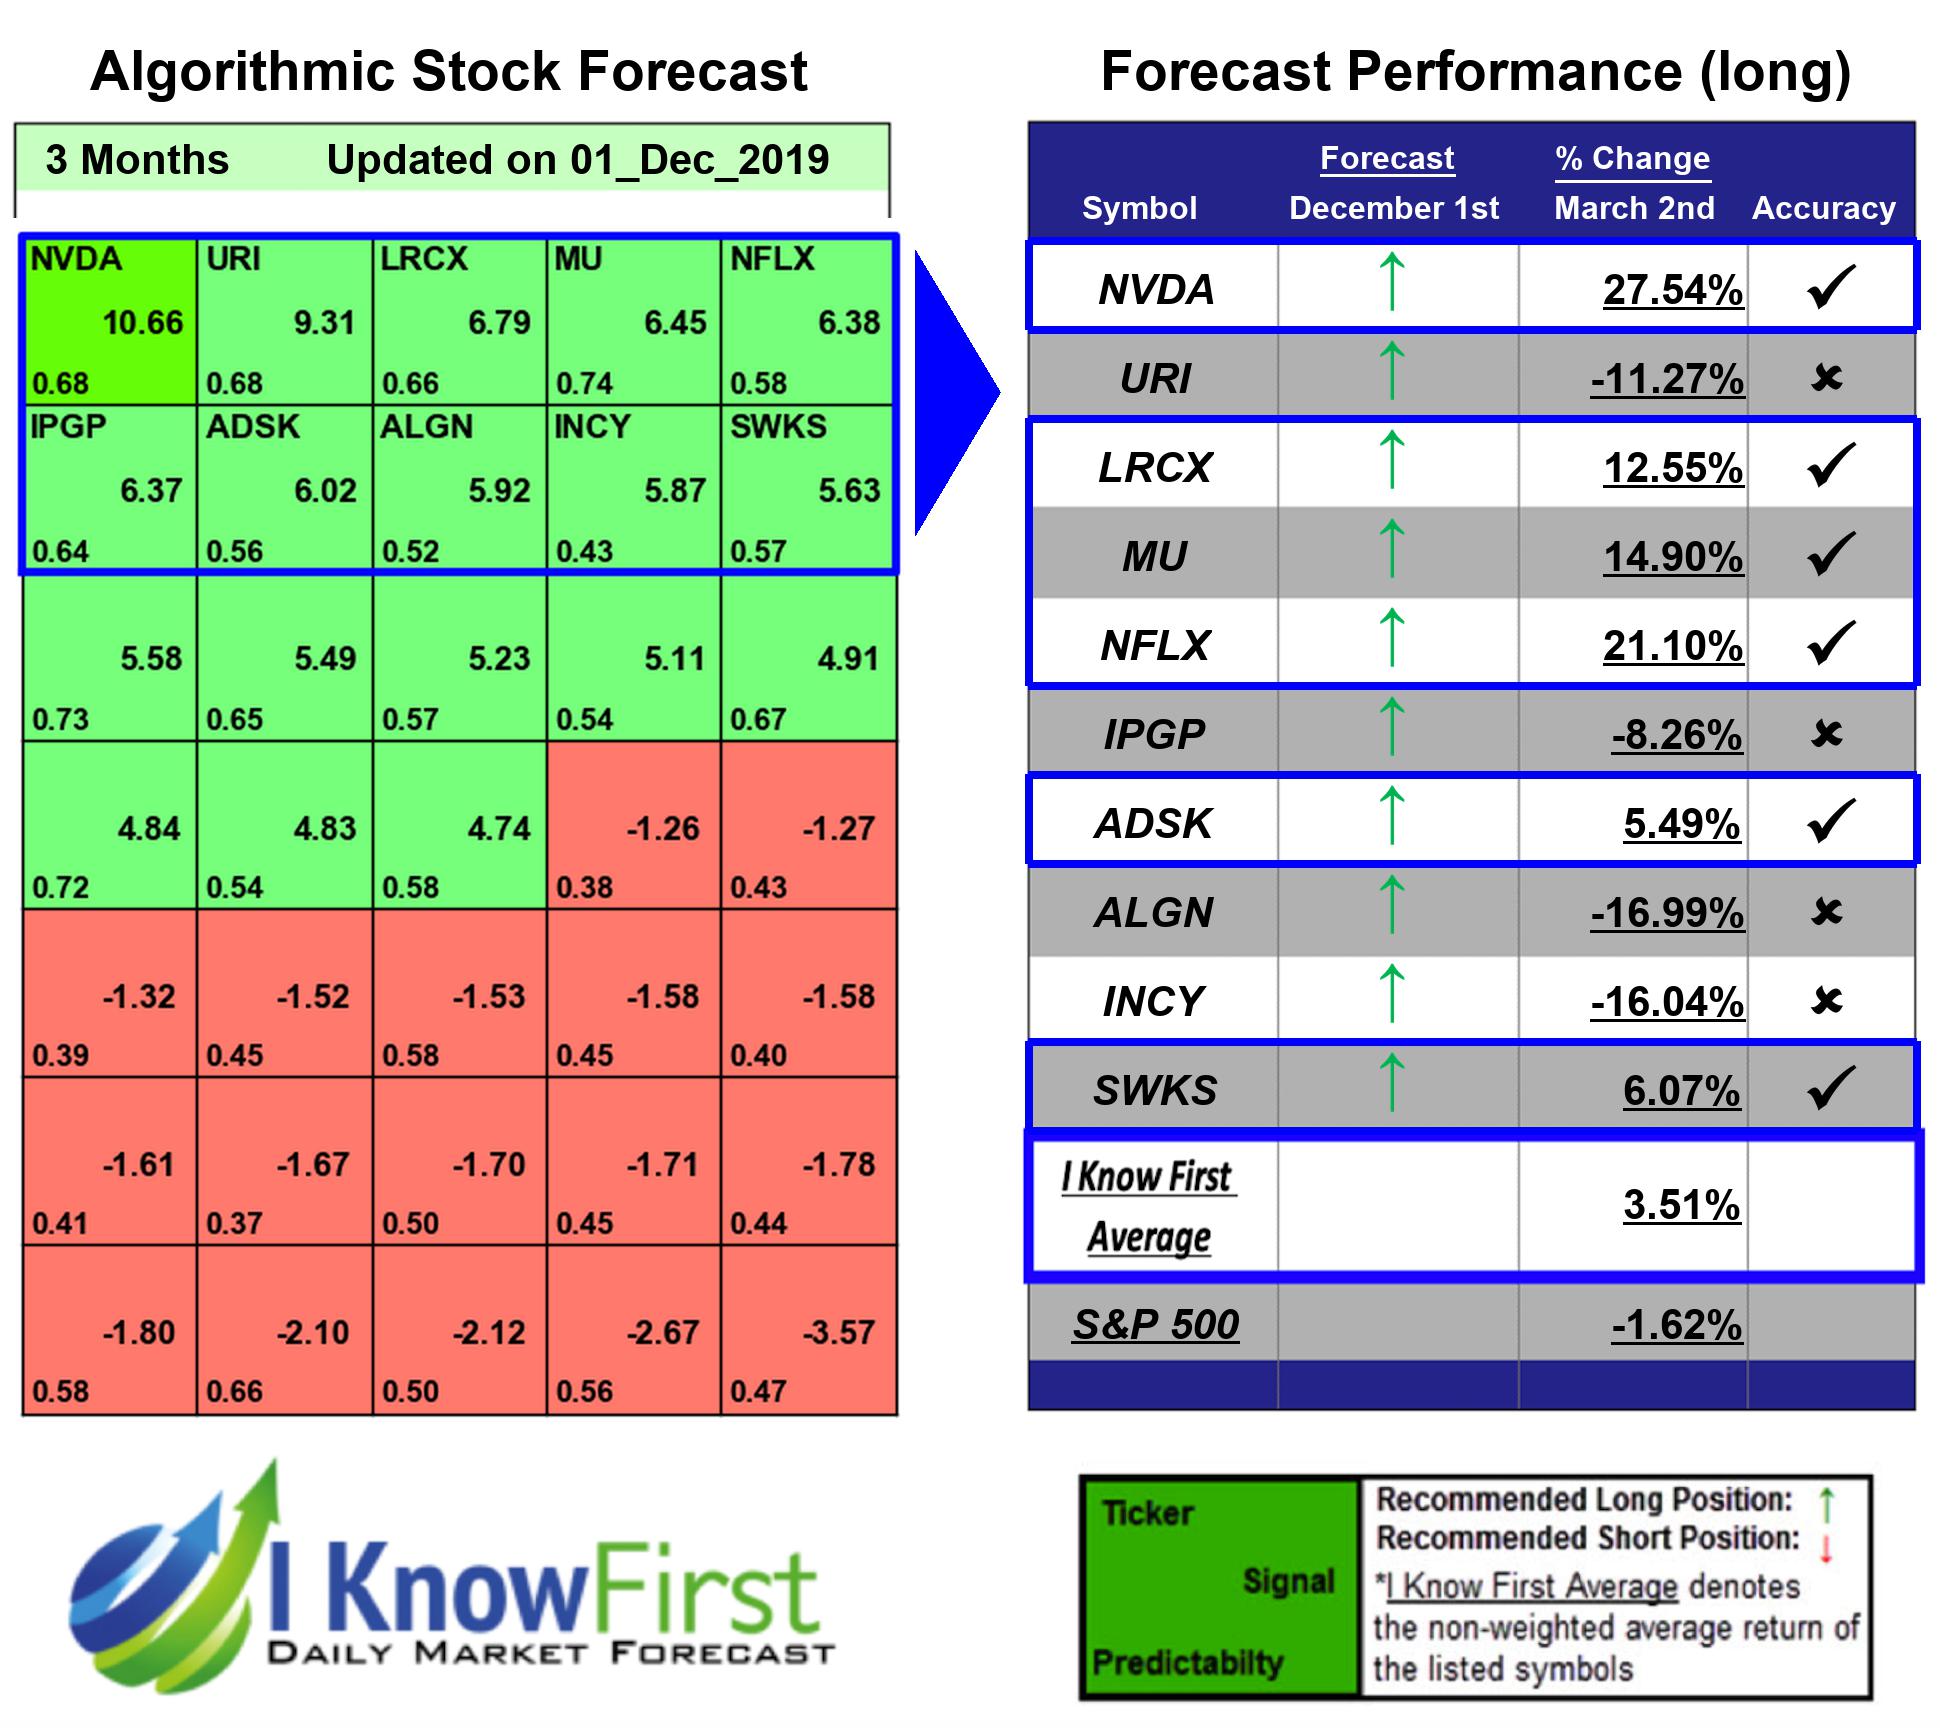
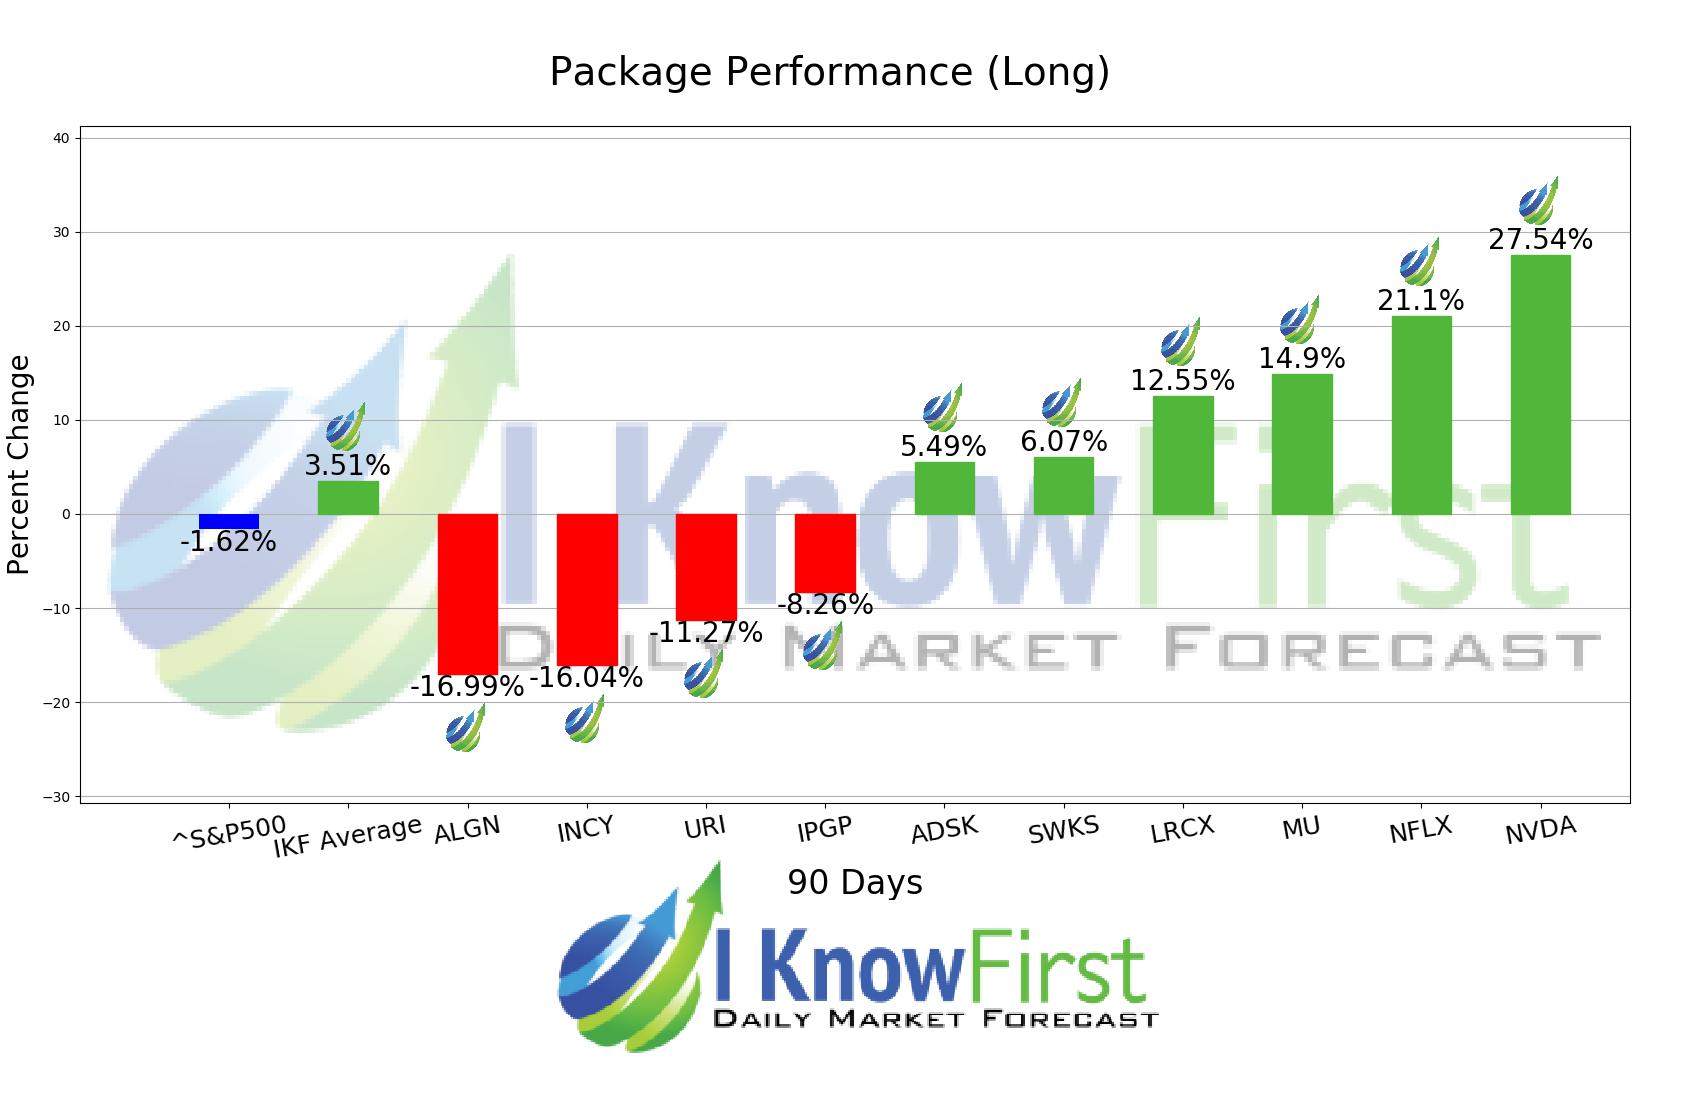
Several predictions in this 3 Months forecast saw significant returns. The algorithm had correctly predicted 6 out 10 stock movements. NVDA was the highest-earning trade with a return of 27.54% in 3 Months. NFLX and MU followed with returns of 21.1% and 14.9% for the 3 Months period. The Top S&P 500 Stocks package had an overall average return of 3.51%, providing investors with a premium of 5.13% over the S&P 500’s return of -1.62%.
NVIDIA Corporation (NVDA) is as a visual computing company worldwide. It operates in two segments, GPU and Tegra Processor. The GPU segment offers processors, which include GeForce for PC gaming; Quadro for design professionals working in computer-aided design, video editing, special effects, and other creative applications
Algorithmic traders utilize these daily forecasts by the I Know First market prediction system as a tool to enhance portfolio performance, verify their own analysis and act on market opportunities faster. This forecast was sent to current I Know First subscribers.
How to interpret this diagram
Algorithmic Stock Forecast: The table on the left is a stock forecast produced by I Know First’s algorithm. Each day, subscribers receive forecasts for six different time horizons. Note that the top 10 stocks in the 1-month forecast may be different than those in the 1-year forecast. In the included table, only the relevant stocks have been included. The boxes are arranged according to their respective signal and predictability values (see below for detailed definitions). A green box represents a positive forecast, suggesting a long position, while a red represents a negative forecast, suggesting a short position.
Please note-for trading decisions use the most recent forecast. Get today’s forecast and Top stock picks.


