
Best S&P 500 Stock Picks Based on Deep Learning: Returns up to 22.37% in 14 Days
Best S&P 500 Stock Picks
This top S&P 500 stock picks forecast is designed for investors and analysts who need predictions for the whole S&P 500 (See S&P 500 Companies Package). It includes 20 stocks with bullish and bearish signals and indicates the best S&P 500 Companies stocks to buy:
- Top 10 S&P 500 stocks for the long position
- Top 10 S&P 500 stocks for the short position

Package Name: Top S&P 500 Stocks
Recommended Positions: Long
Forecast Length: 14 Days (10/30/2020 – 11/14/2020)
I Know First Average: 15.43%

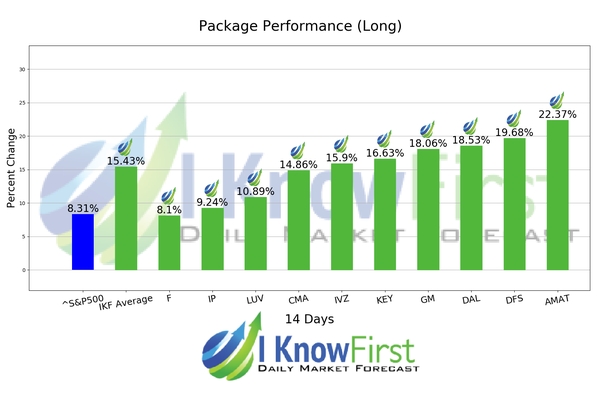
During the 14 Days forecasted period several picks in the Top S&P 500 Stocks Package saw significant returns. The algorithm had correctly predicted 10 out 10 returns. The highest trade return came from AMAT, at 22.37%. DFS and DAL followed with returns of 19.68% and 18.53% for the 14 Days period. With these notable trade returns, the package itself registered an average return of 15.43% compared to the S&P 500’s return of 8.31% for the same period.
Applied Materials, Inc. (Applied), incorporated on March 18, 1987, provides manufacturing equipment, services and software to the global semiconductor, display and related industries. The Company’s segments are Semiconductor Systems; Applied Global Services; Display and Adjacent Markets, and Corporate and Other. The Semiconductor Systems segment includes semiconductor capital equipment for etch, rapid thermal processing, deposition, chemical mechanical planarization, metrology and inspection, wafer packaging and ion implantation. Its Applied Global Services segment provides integrated solutions to optimize equipment and fab performance and productivity, including spares, upgrades, services, certain remanufactured earlier generation equipment and factory automation software for semiconductor, display and solar products. The Display and Adjacent Markets segment includes products for manufacturing liquid crystal displays (LCDs), organic light-emitting diodes (OLEDs), upgrades and roll-to-roll Web coating systems and other display technologies for televisions, personal computers, smart phones and other consumer-oriented devices. The Corporate and Other segment includes revenues from products, as well as costs of products sold for fabricating solar photovoltaic cells and modules, and certain operating expenses.
Algorithmic traders utilize these daily forecasts by the I Know First market prediction system as a tool to enhance portfolio performance, verify their own analysis and act on market opportunities faster. This forecast was sent to current I Know First subscribers.
How to interpret this diagram
Algorithmic Stock Forecast: The table on the left is a stock forecast produced by I Know First’s algorithm. Each day, subscribers receive forecasts for six different time horizons. Note that the top 10 stocks in the 1-month forecast may be different than those in the 1-year forecast. In the included table, only the relevant stocks have been included. The boxes are arranged according to their respective signal and predictability values (see below for detailed definitions). A green box represents a positive forecast, suggesting a long position, while a red represents a negative forecast, suggesting a short position.
Please note-for trading decisions use the most recent forecast. Get today’s forecast and Top stock picks.


