
Best S&P 500 Stock Picks Based on Algo Trading: Returns up to 169.62% in 1 Year
Best S&P 500 Stock Picks
This top S&P 500 stock picks forecast is designed for investors and analysts who need predictions for the whole S&P 500 (See S&P 500 Companies Package). It includes 20 stocks with bullish and bearish signals and indicates the best S&P 500 Companies stocks to buy:
- Top 10 S&P 500 stocks for the long position
- Top 10 S&P 500 stocks for the short position

Package Name: Top S&P 500 Stocks
Recommended Positions: Long
Forecast Length: 1 Year (4/12/20 – 4/12/21)
I Know First Average: 90.89%

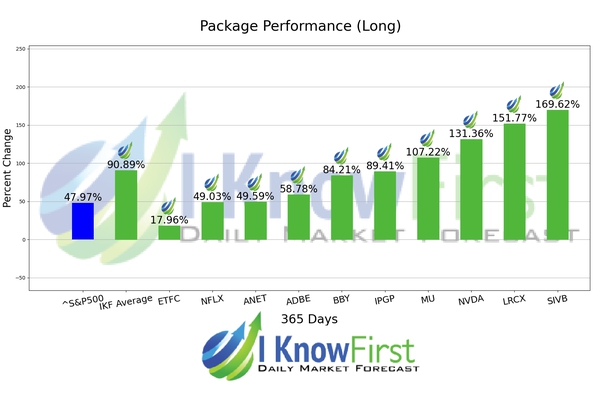
Several predictions in this 1 Year forecast saw significant returns. The algorithm had correctly predicted 10 out 10 stock movements. The greatest return came from SIVB at 169.62%. LRCX and NVDA followed with returns of 151.77% and 131.36% for the 1 Year period. The package had an overall average return of 90.89%, providing investors with a 42.92% premium over the S&P 500’s return of 47.97% during the period.
SVB Financial Group (SVB Financial), incorporated on March 22, 1999, is a diversified financial services company, as well as a bank holding and a financial holding company. The Company operates through three segments: Global Commercial Bank, SVB Private Bank and SVB Capital. The Company, through its subsidiaries and divisions, offers a range of banking and financial products and services to clients across the United States. The Company offers services in the technology, life science/healthcare, private equity/venture capital and wine industries.
Algorithmic traders utilize these daily forecasts by the I Know First market prediction system as a tool to enhance portfolio performance, verify their own analysis and act on market opportunities faster. This forecast was sent to current I Know First subscribers.
How to interpret this diagram
Algorithmic Stock Forecast: The table on the left is a stock forecast produced by I Know First’s algorithm. Each day, subscribers receive forecasts for six different time horizons. Note that the top 10 stocks in the 1-month forecast may be different than those in the 1-year forecast. In the included table, only the relevant stocks have been included. The boxes are arranged according to their respective signal and predictability values (see below for detailed definitions). A green box represents a positive forecast, suggesting a long position, while a red represents a negative forecast, suggesting a short position.
Please note-for trading decisions use the most recent forecast. Get today’s forecast and Top stock picks.


