
Best Small Cap Stocks Based on Big Data Analytics: Returns up to 89.97% in 1 Year
Best Small Cap Stocks
The Small Cap Package includes recommendations by the I Know First algorithm for small cap stocks to buy with a market capitalization of less than $1 billion:
- Top 10 Small Cap stocks to buy for the long position
- Top 10 Small Cap stocks to buy for the short position

Package Name: Small Cap Forecast
Recommended Positions: Long
Forecast Length: 1 Year (6/9/2019 – 6/9/2020)
I Know First Average: 18.48%
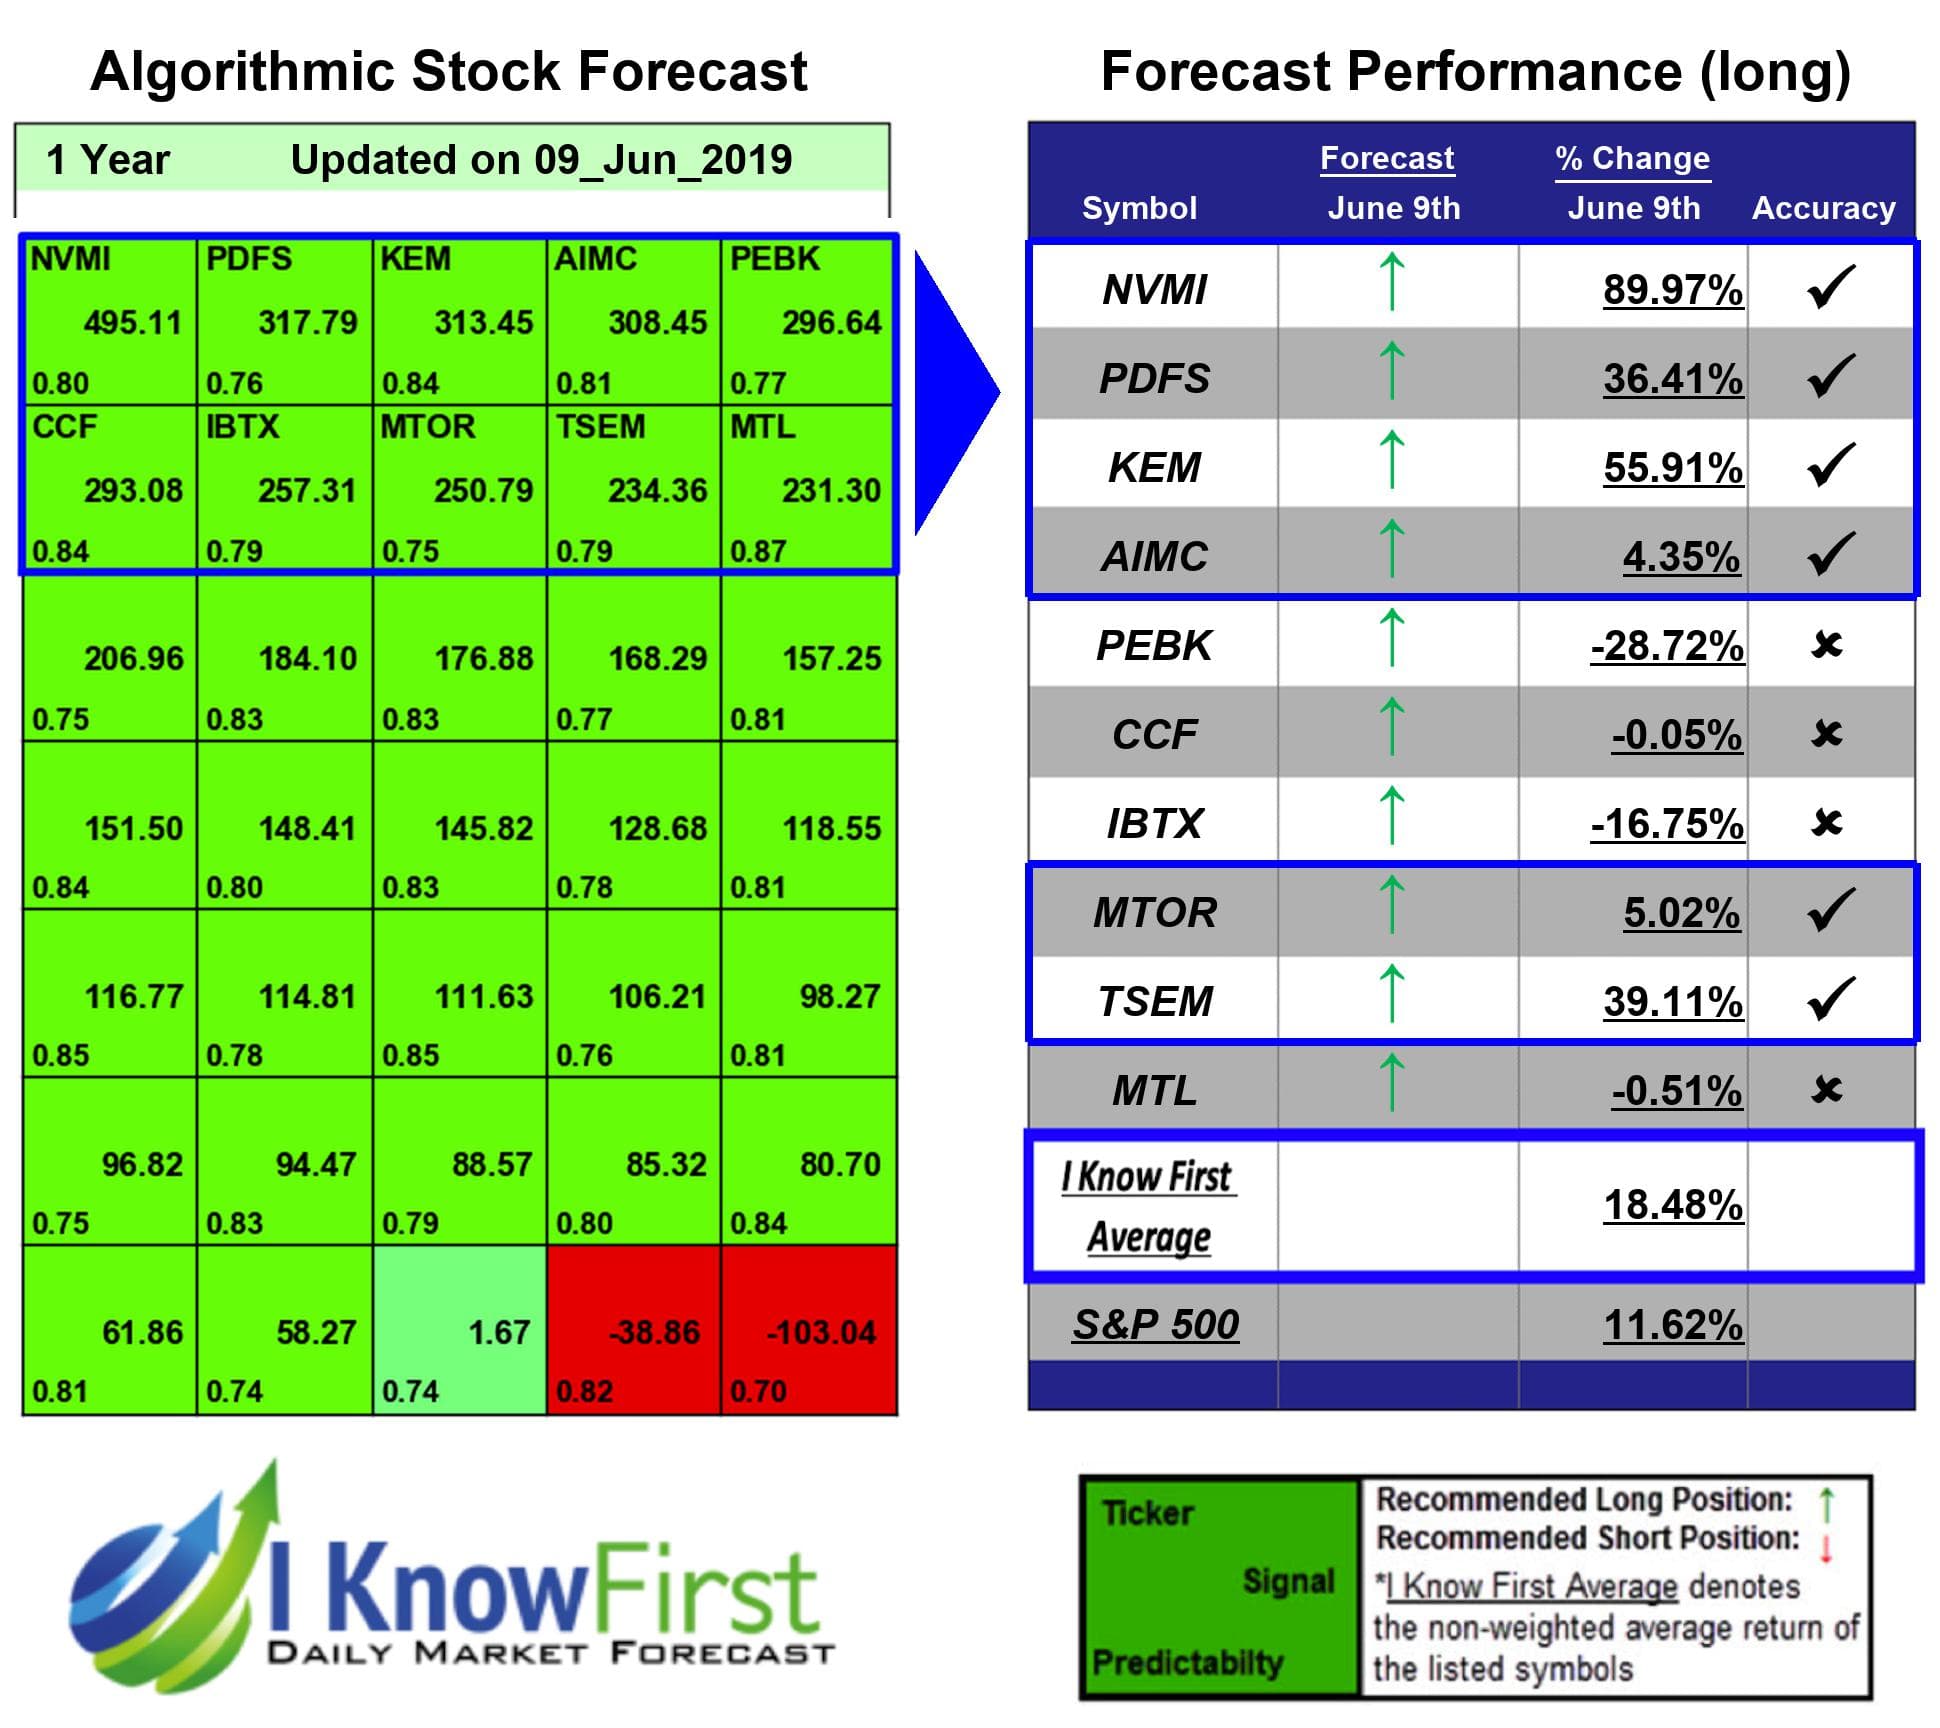
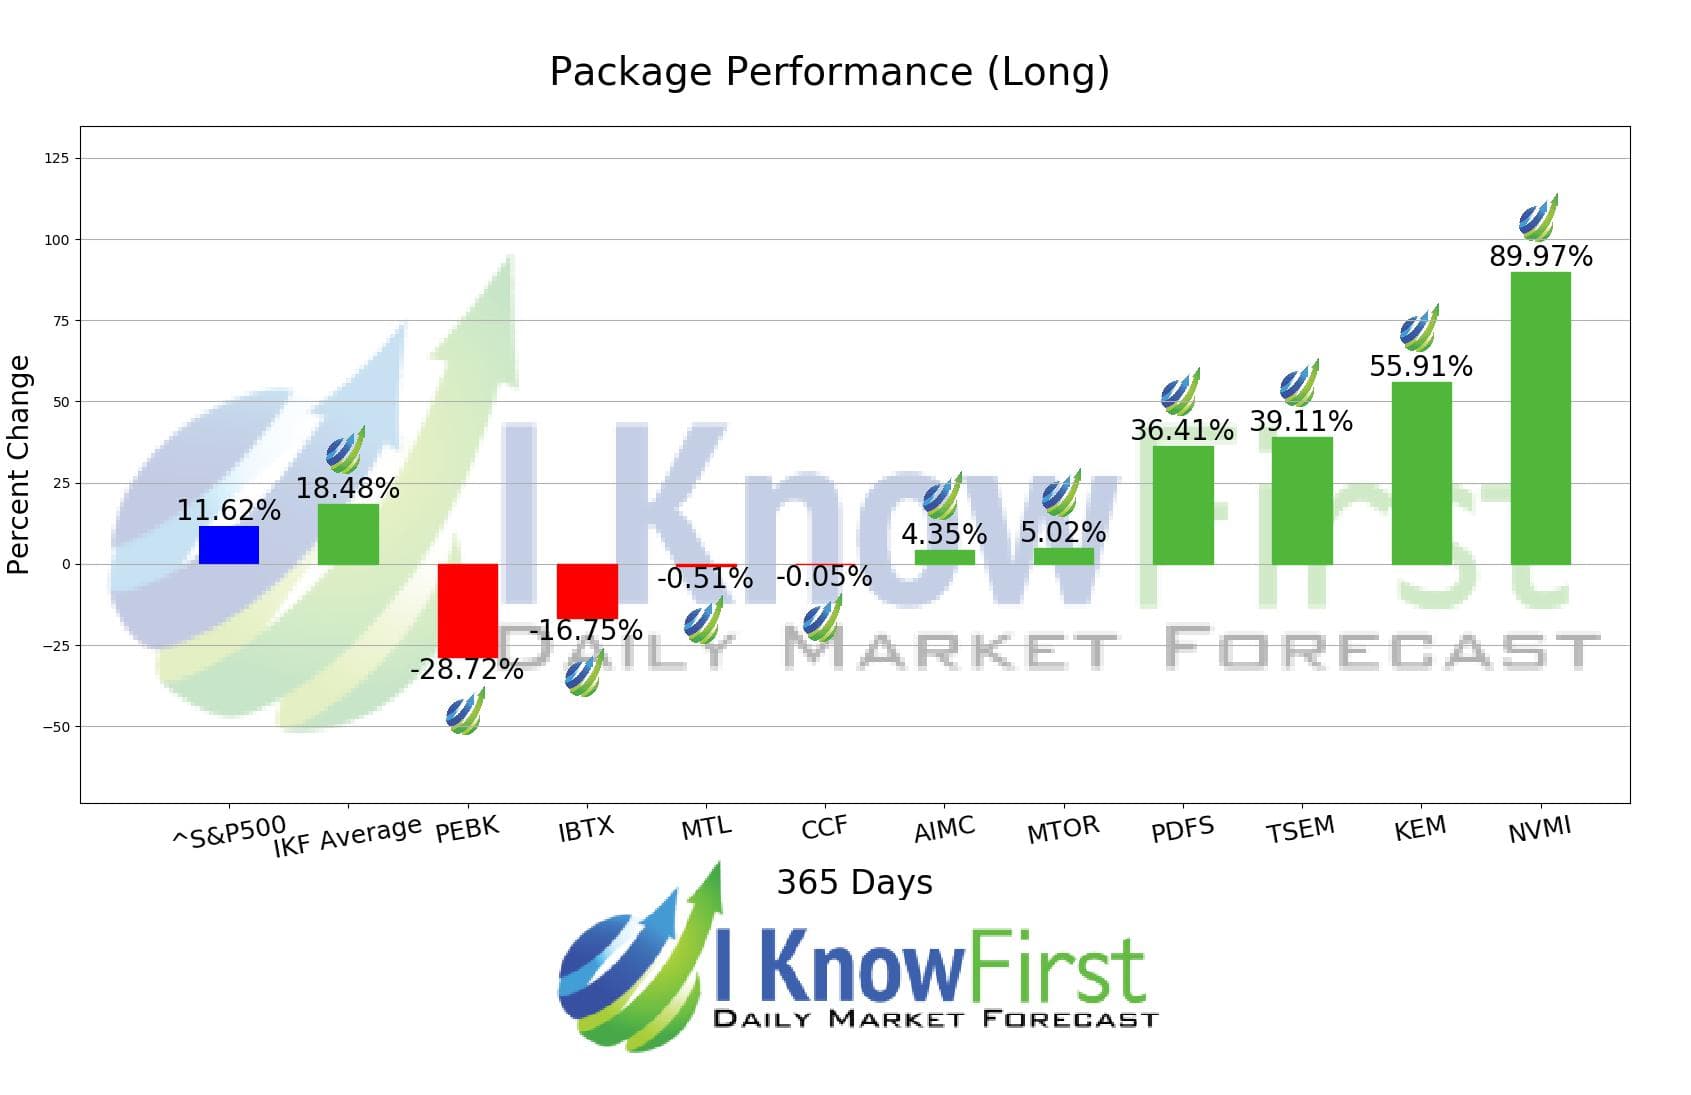
6 out of 10 stock prices in this forecast for the Small Cap Forecast Package moved as predicted by the algorithm. The top-performing prediction in this forecast was NVMI, which registered a return of 89.97%. KEM and TSEM also performed well for this time horizon with returns of 55.91% and 39.11%, respectively. The package saw an overall yield of 18.48% versus the S&P 500’s return of 11.62% implying a market premium of 6.86%.
Nova Measuring Instruments Ltd. designs, develops, produces, and sells process control systems used in the manufacture of semiconductors in Israel. The company offers in-line and x-ray stand-alone metrology systems, as well as integrated optical metrology systems that attach directly to wafer fabrication process equipment. Nova Measuring Instruments Ltd. was founded in 1993 and is headquartered in Ness Ziona, Israel.
Algorithmic traders utilize these daily forecasts by the I Know First market prediction system as a tool to enhance portfolio performance, verify their own analysis and act on market opportunities faster. This forecast was sent to current I Know First subscribers.
How to interpret this diagram
Algorithmic Stock Forecast: The table on the left is a stock forecast produced by I Know First’s algorithm. Each day, subscribers receive forecasts for six different time horizons. Note that the top 10 stocks in the 1-month forecast may be different than those in the 1-year forecast. In the included table, only the relevant stocks have been included. The boxes are arranged according to their respective signal and predictability values (see below for detailed definitions). A green box represents a positive forecast, suggesting a long position, while a red represents a negative forecast, suggesting a short position.
Please note-for trading decisions use the most recent forecast. Get today’s forecast and Top stock picks.


