
Best Small Cap Stocks Based on Big Data Analytics: Returns up to 28.43% in 14 Days
Best Small Cap Stocks
The Small Cap Package includes recommendations by the I Know First algorithm for small cap stocks to buy with a market capitalization of less than $1 billion:
- Top 10 Small Cap stocks to buy for the long position
- Top 10 Small Cap stocks to buy for the short position

Package Name: Small Cap Forecast
Recommended Positions: Long
Forecast Length: 14 Days (5/6/2020 – 5/20/2020)
I Know First Average: 9.49%
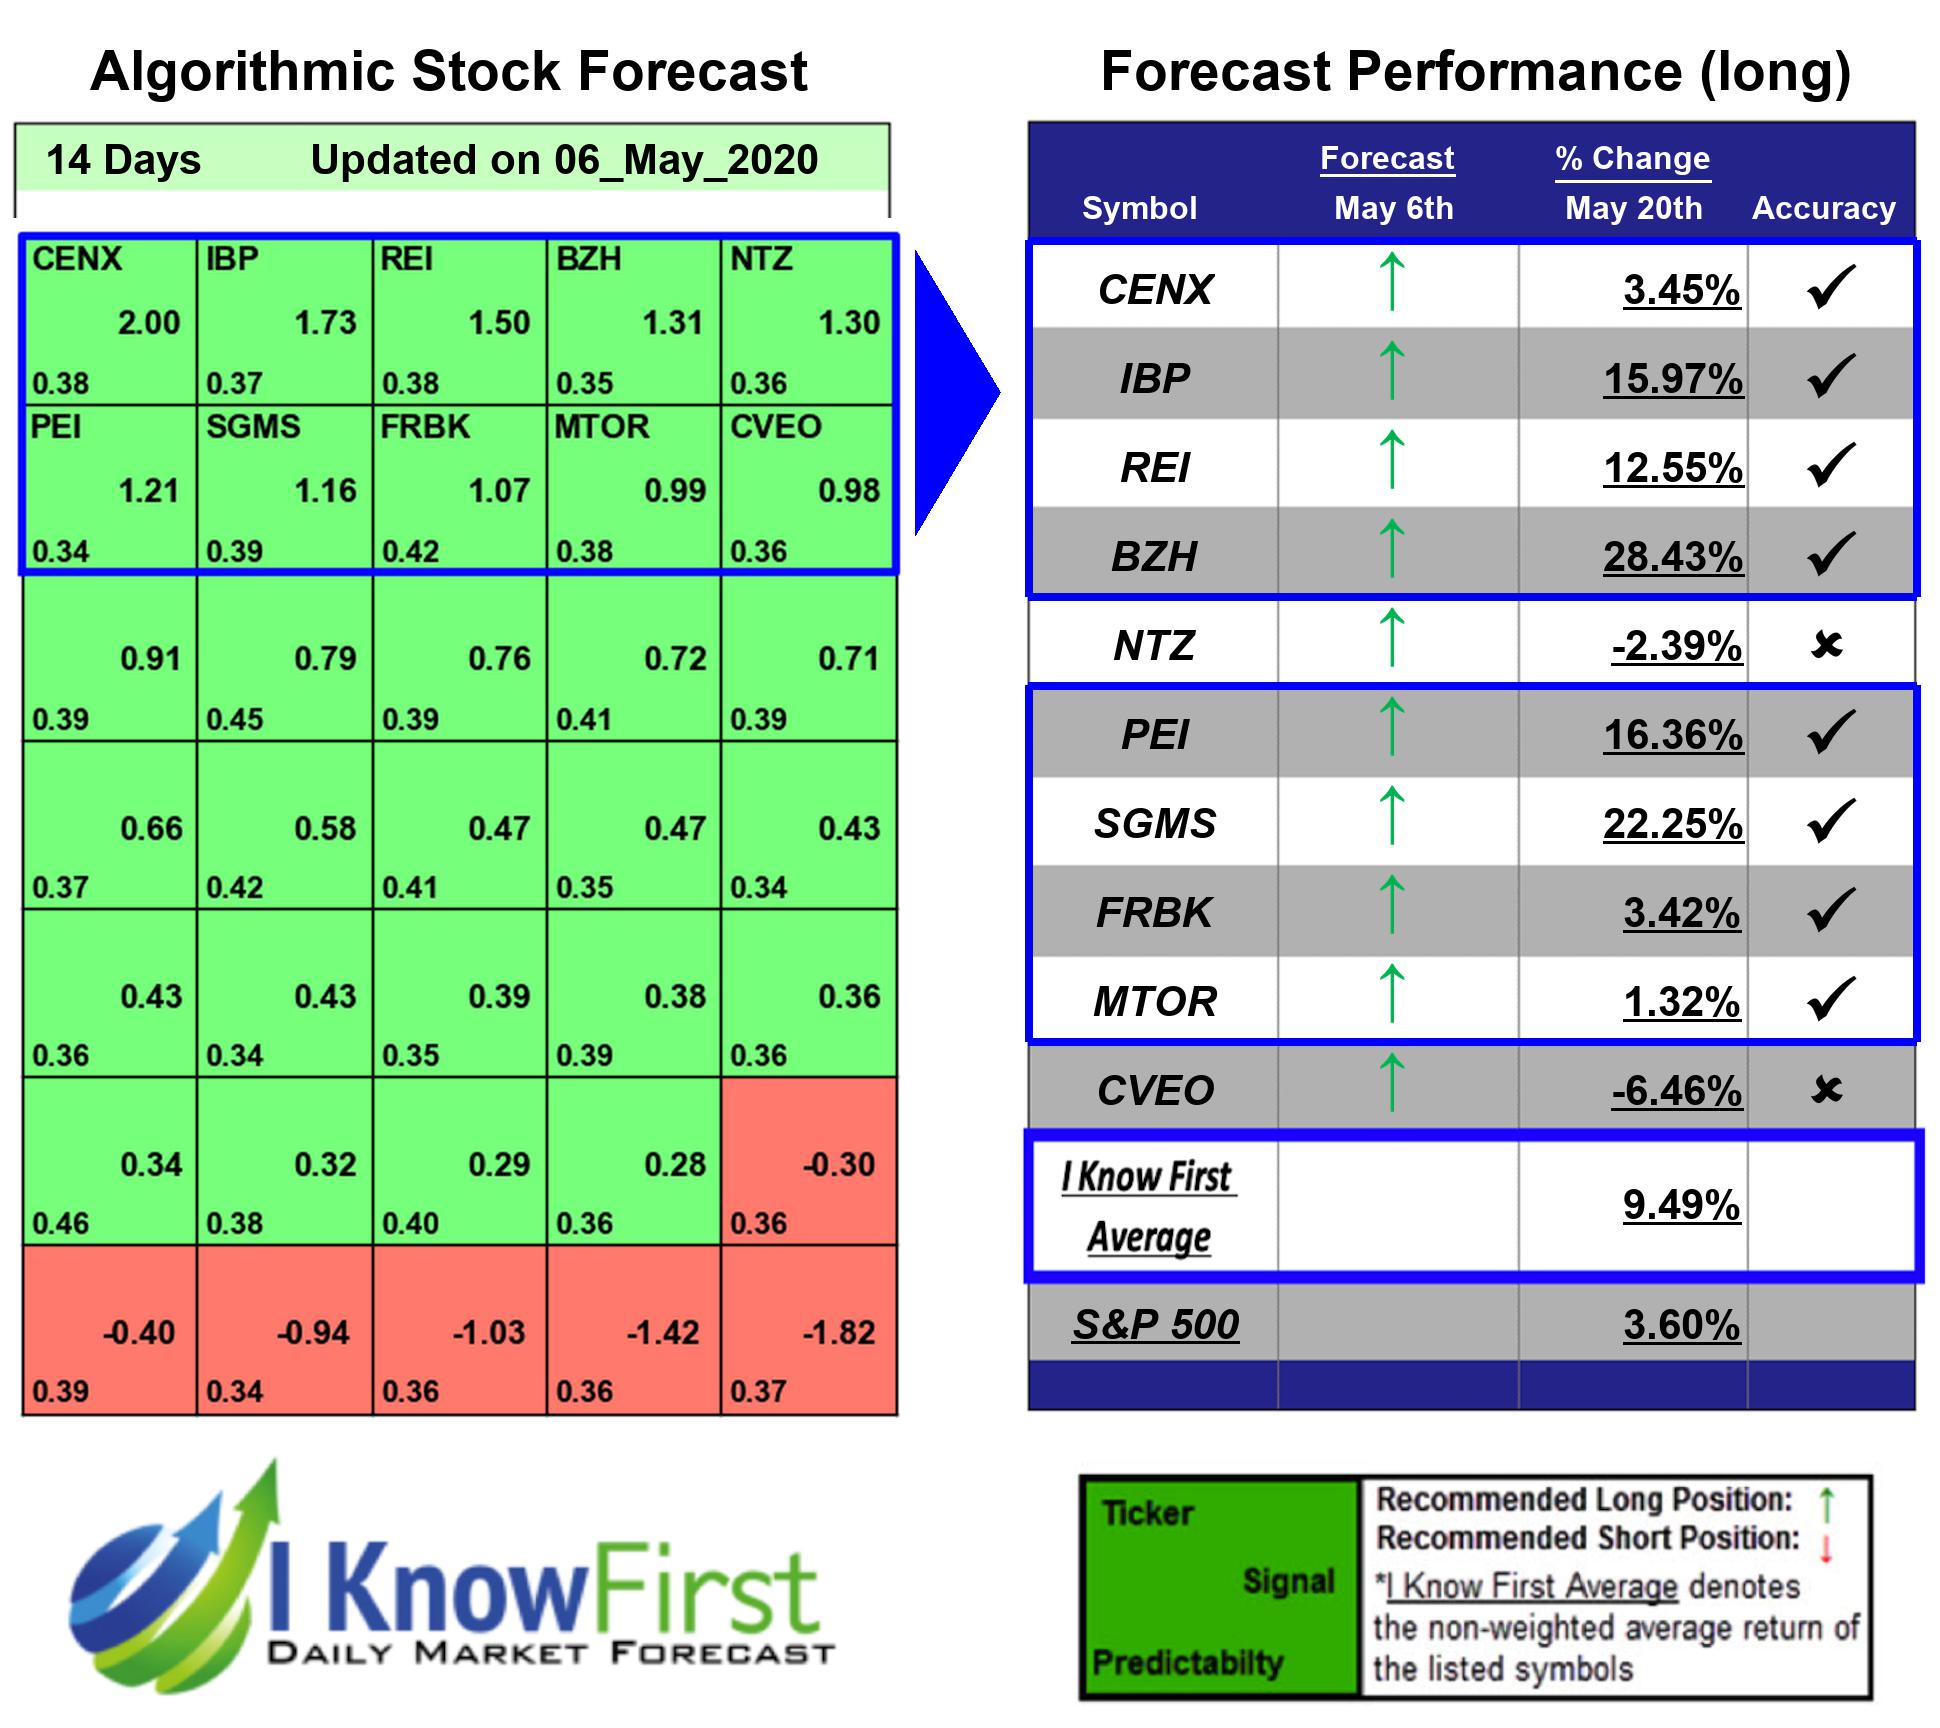

Several predictions in this 14 Days forecast saw significant returns. The algorithm had correctly predicted 8 out 10 stock movements. BZH was our best stock pick this week a return of 28.43%. The suggested trades for SGMS and PEI also had notable 14 Days yields of 22.25% and 16.36%, respectively. The package’s overall average return was 9.49%, providing investors with a 5.89% premium over the S&P 500’s return of 3.6% during the same period.
Beazer Homes USA, Inc. (BZH) operates as a homebuilder in the United States. The company designs, constructs, and sells single-family and multi-family homes for entry-level, move-up, or retirement-oriented home buyers under the Beazer Homes brand name. It sells its homes through commissioned new home sales counselors and independent brokers in Arizona, California, Nevada, Texas, Indiana, Maryland/Delaware, Tennessee, Virginia, Florida, Georgia, North Carolina, and South Carolina. Beazer Homes USA, Inc. (BZH) was founded in 1985 and is headquartered in Atlanta, Georgia.
Algorithmic traders utilize these daily forecasts by the I Know First market prediction system as a tool to enhance portfolio performance, verify their own analysis and act on market opportunities faster. This forecast was sent to current I Know First subscribers.
How to interpret this diagram
Algorithmic Stock Forecast: The table on the left is a stock forecast produced by I Know First’s algorithm. Each day, subscribers receive forecasts for six different time horizons. Note that the top 10 stocks in the 1-month forecast may be different than those in the 1-year forecast. In the included table, only the relevant stocks have been included. The boxes are arranged according to their respective signal and predictability values (see below for detailed definitions). A green box represents a positive forecast, suggesting a long position, while a red represents a negative forecast, suggesting a short position.
Please note-for trading decisions use the most recent forecast. Get today’s forecast and Top stock picks.


