
Best Small Cap Stocks Based on a Self-learning Algorithm: Returns up to 133.61% in 1 Year
Best Small Cap Stocks
The Small Cap Stocks Package includes recommendations by the I Know First algorithm for small cap stocks to buy with a market capitalization of less than $1 billion:
- Top 10 Small Cap stocks to buy for the long position
- Top 10 Small Cap stocks to buy for the short position

Package Name: Small Cap Forecast
Recommended Positions: Long
Forecast Length: 1 Year (7/26/20 – 7/27/21)
I Know First Average: 43.34%
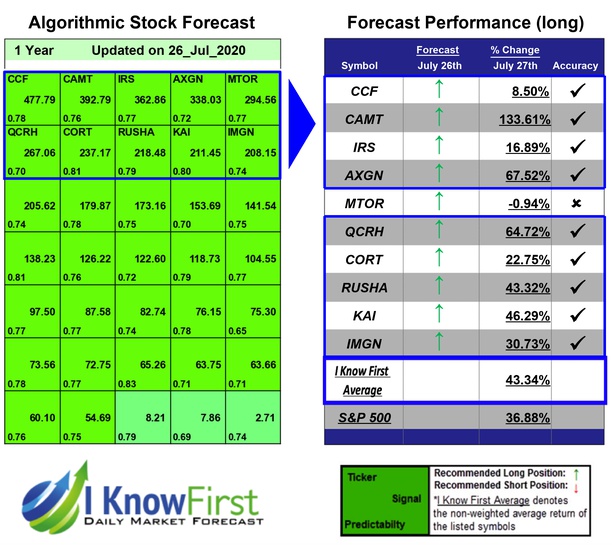
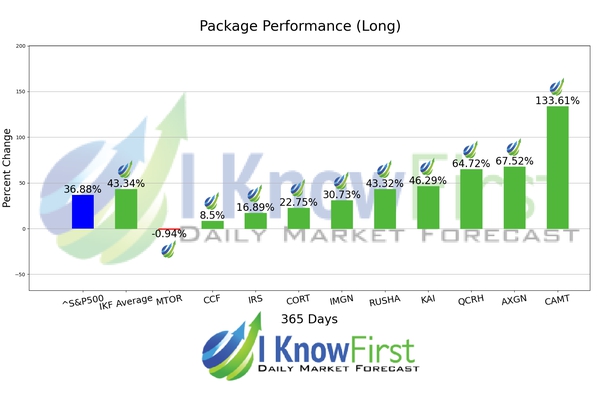
In this 1 Year forecast for the Small Cap Forecast Package, there were many high performing trades and the algorithm correctly predicted 9 out 10 trades. The top-performing prediction in this forecast was CAMT, which registered a return of 133.61%. AXGN and QCRH followed with returns of 67.52% and 64.72% for the 1 Year period. The overall average return in this Small Cap Forecast package was 43.34%, providing investors with a 6.46% premium over the S&P 500’s return of 36.88% during the same period.
Camtek Ltd. designs, develops, manufactures, and markets automated optical inspection (AOI) systems for semiconductor wafers, integrated circuit substrates, and printed circuit boards (PCBs) in Israel. It operates in two segments, Microelectronics and PCB. The company was founded in 1987 and is headquartered in Migdal HaEmek, Israel.
Algorithmic traders utilize these daily forecasts by the I Know First market prediction system as a tool to enhance portfolio performance, verify their own analysis and act on market opportunities faster. This forecast was sent to current I Know First subscribers.
How to interpret this diagram
Algorithmic Stock Forecast: The table on the left is a stock forecast produced by I Know First’s algorithm. Each day, subscribers receive forecasts for six different time horizons. Note that the top 10 stocks in the 1-month forecast may be different than those in the 1-year forecast. In the included table, only the relevant stocks have been included. The boxes are arranged according to their respective signal and predictability values (see below for detailed definitions). A green box represents a positive forecast, suggesting a long position, while a red represents a negative forecast, suggesting a short position.
Please note-for trading decisions use the most recent forecast. Get today’s forecast and Top stock picks.


