
Best Real Estate Stocks Based on Genetic Algorithms: Returns up to 14.26% in 3 Months
Best Real Estate Stocks
This Real Estate Stocks forecast is designed for investors and analysts who need predictions for the best stocks to invest in the real estate sector (see Real Estate Stocks Package). It includes 20 stocks with bullish and bearish signals:
- Top 10 Real Estate stocks for the long position
- Top 10 Real Estate stocks for the short position
![]()
![]()
Package Name: Real Estate Stock Forecast
Recommended Positions: Long
Forecast Length: 3 Months (5/14/2019 – 8/14/2019)
I Know First Average: 6.76%
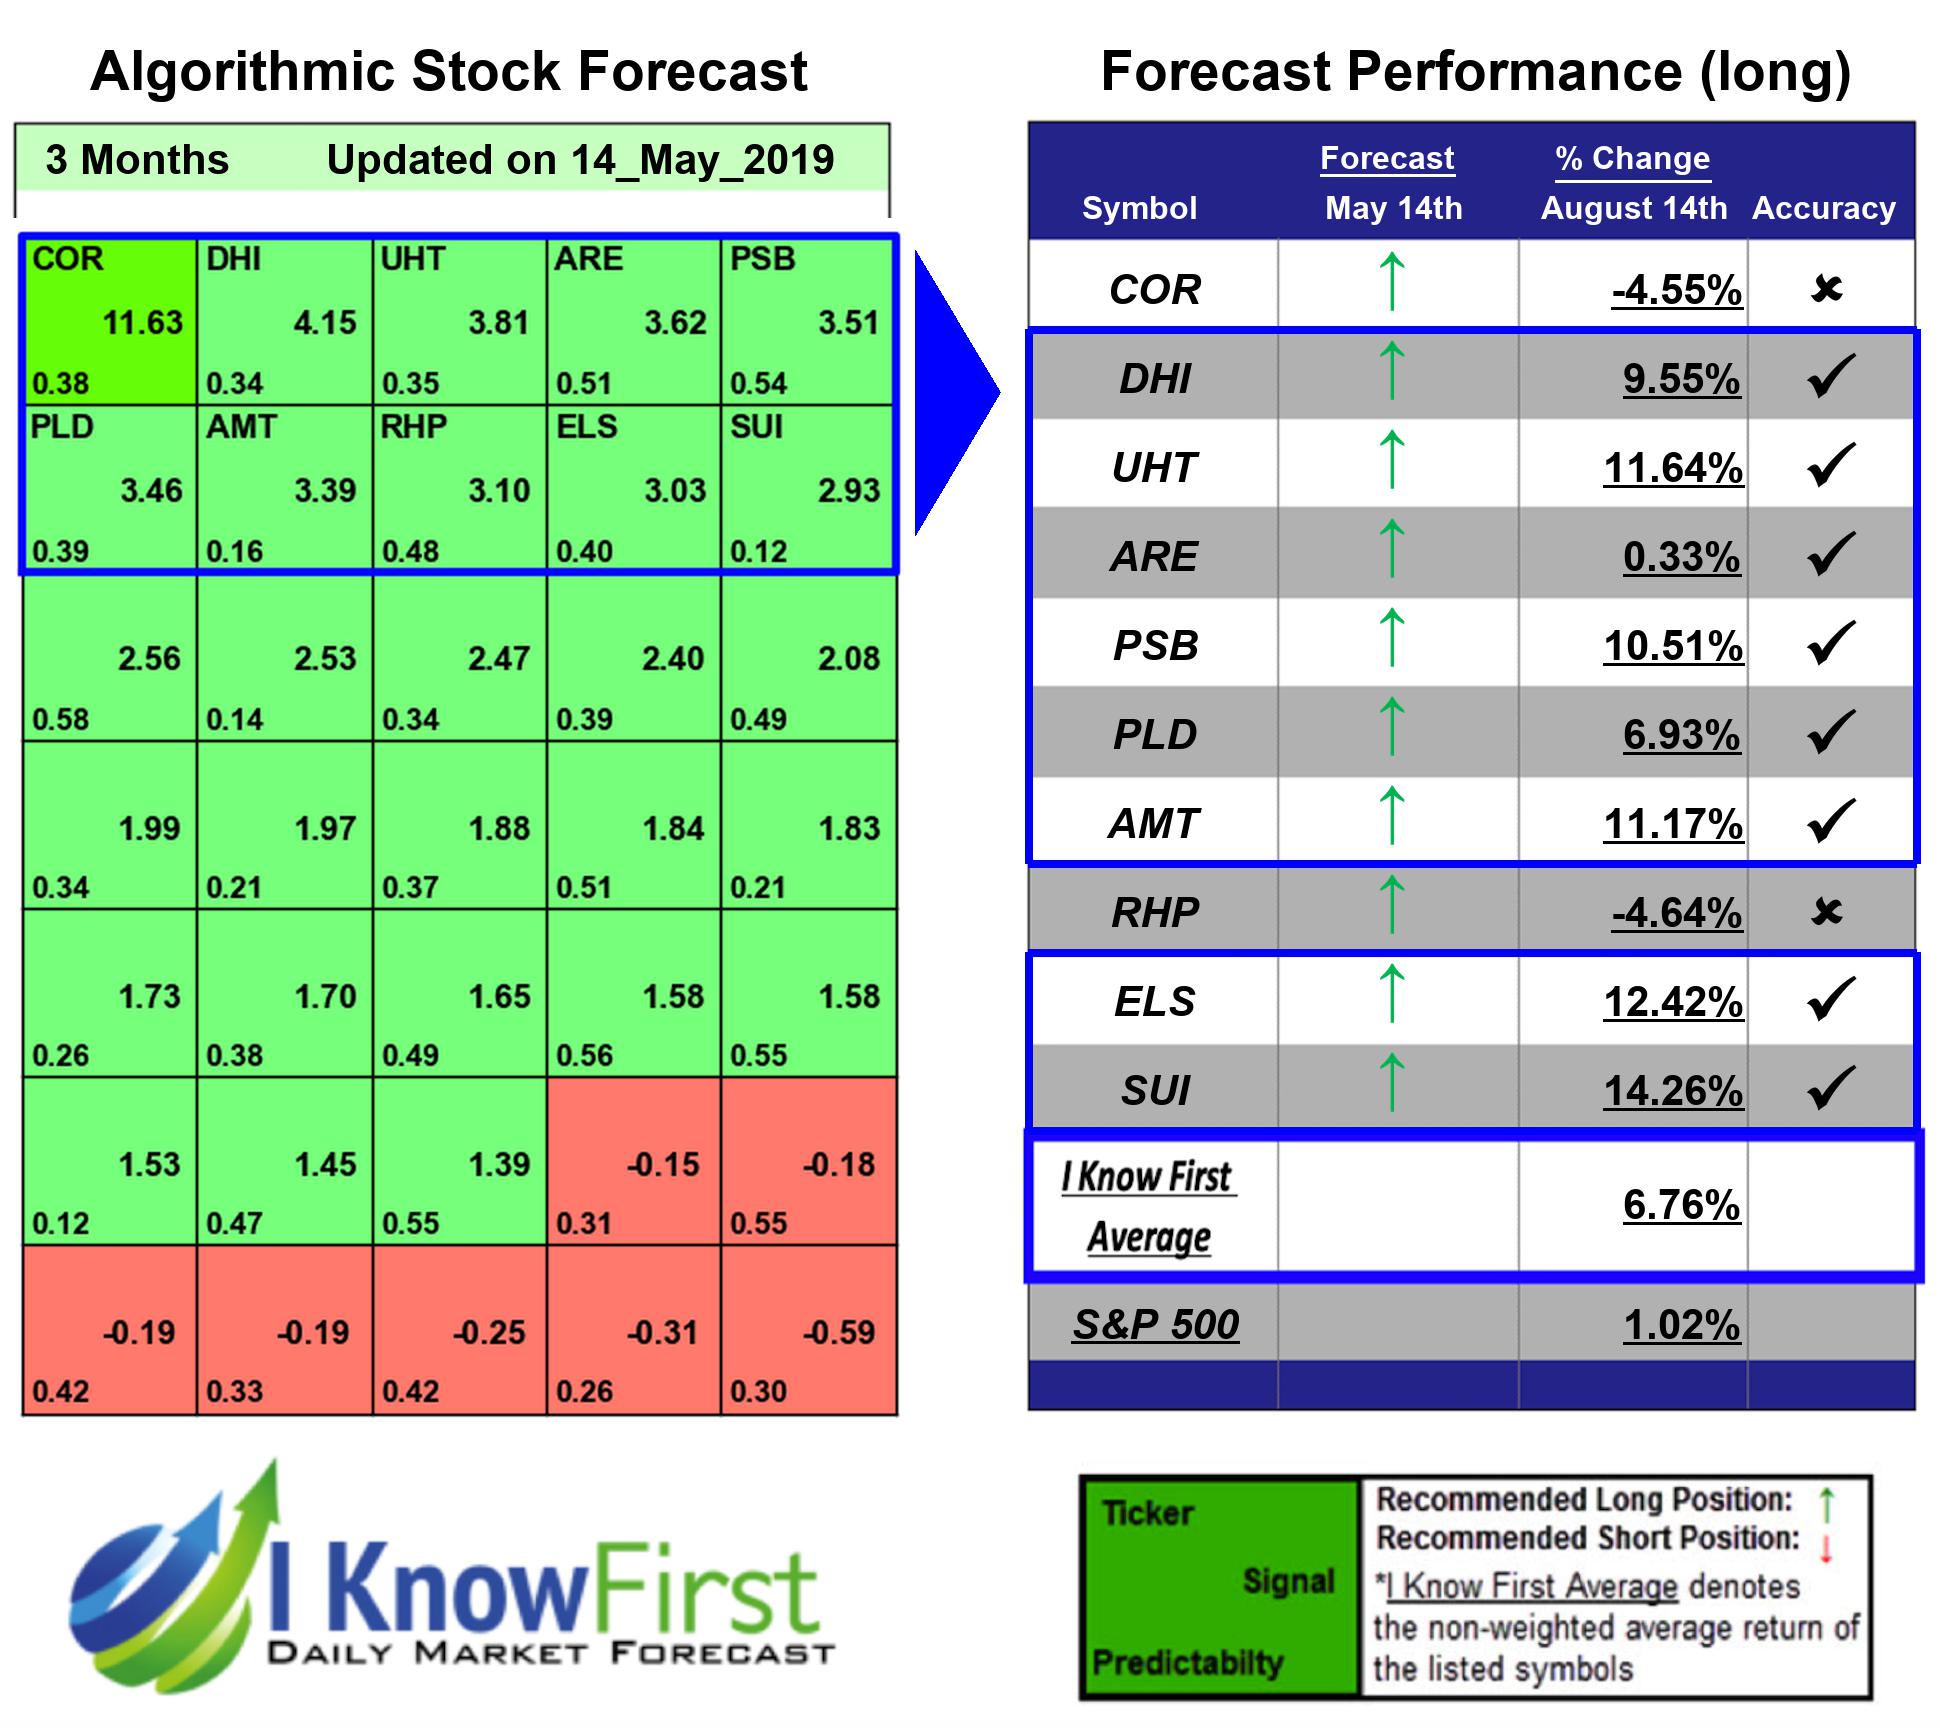

I Know First’s State of the Art Algorithm accurately forecasted 8 out of 10 trades in this Real Estate Stock Forecast Package for the 3 Months time period. SUI was the top performing prediction with a return of 14.26%. Other notable stocks were ELS and UHT with a return of 12.42% and 11.64%. The overall average return in this Real Estate Stock Forecast package was 6.76%, providing investors with a 5.74% premium over the S&P 500’s return of 1.02% during the same period.
Sun Communities, Inc. (SUI) operates as a real estate investment trust (REIT). It owns, operates, and develops manufactured housing communities in the midwestern, southern, and southeastern United States. As of April 1, 2011, it owned and operated a portfolio of 136 communities comprising approximately 47,600 developed sites. As a REIT, it would not be subject to federal tax to the extent that it distributes at least 90% of its taxable income to its shareholders. The company, through its subsidiary, Sun Home Services, Inc., also involves in marketing, selling, and leasing new and pre-owned homes. Sun Communities, Inc. (SUI) was founded in 1975 and is headquartered in Southfield, Michigan.
Algorithmic traders utilize these daily forecasts by the I Know First market prediction system as a tool to enhance portfolio performance, verify their own analysis and act on market opportunities faster. This forecast was sent to current I Know First subscribers.
How to interpret this diagram
Algorithmic Stock Forecast: The table on the left is a stock forecast produced by I Know First’s algorithm. Each day, subscribers receive forecasts for six different time horizons. Note that the top 10 stocks in the 1-month forecast may be different than those in the 1-year forecast. In the included table, only the relevant stocks have been included. The boxes are arranged according to their respective signal and predictability values (see below for detailed definitions). A green box represents a positive forecast, suggesting a long position, while a red represents a negative forecast, suggesting a short position.
Please note-for trading decisions use the most recent forecast. Get today’s forecast and Top stock picks.


