
Best Real Estate Stocks Based on a Self-learning Algorithm: Returns up to 30.81% in 3 Days
Best Real Estate Stocks
This Real Estate Stocks forecast is designed for investors and analysts who need predictions for the best stocks to invest in the real estate sector (see Real Estate Stocks Package). It includes 20 stocks with bullish and bearish signals:
- Top 10 Real Estate stocks for the long position
- Top 10 Real Estate stocks for the short position
![]()
![]()
Package Name: Real Estate Stock Forecast
Recommended Positions: Long
Forecast Length: 3 Days (3/25/2020 – 3/28/2020)
I Know First Average: 9.59%
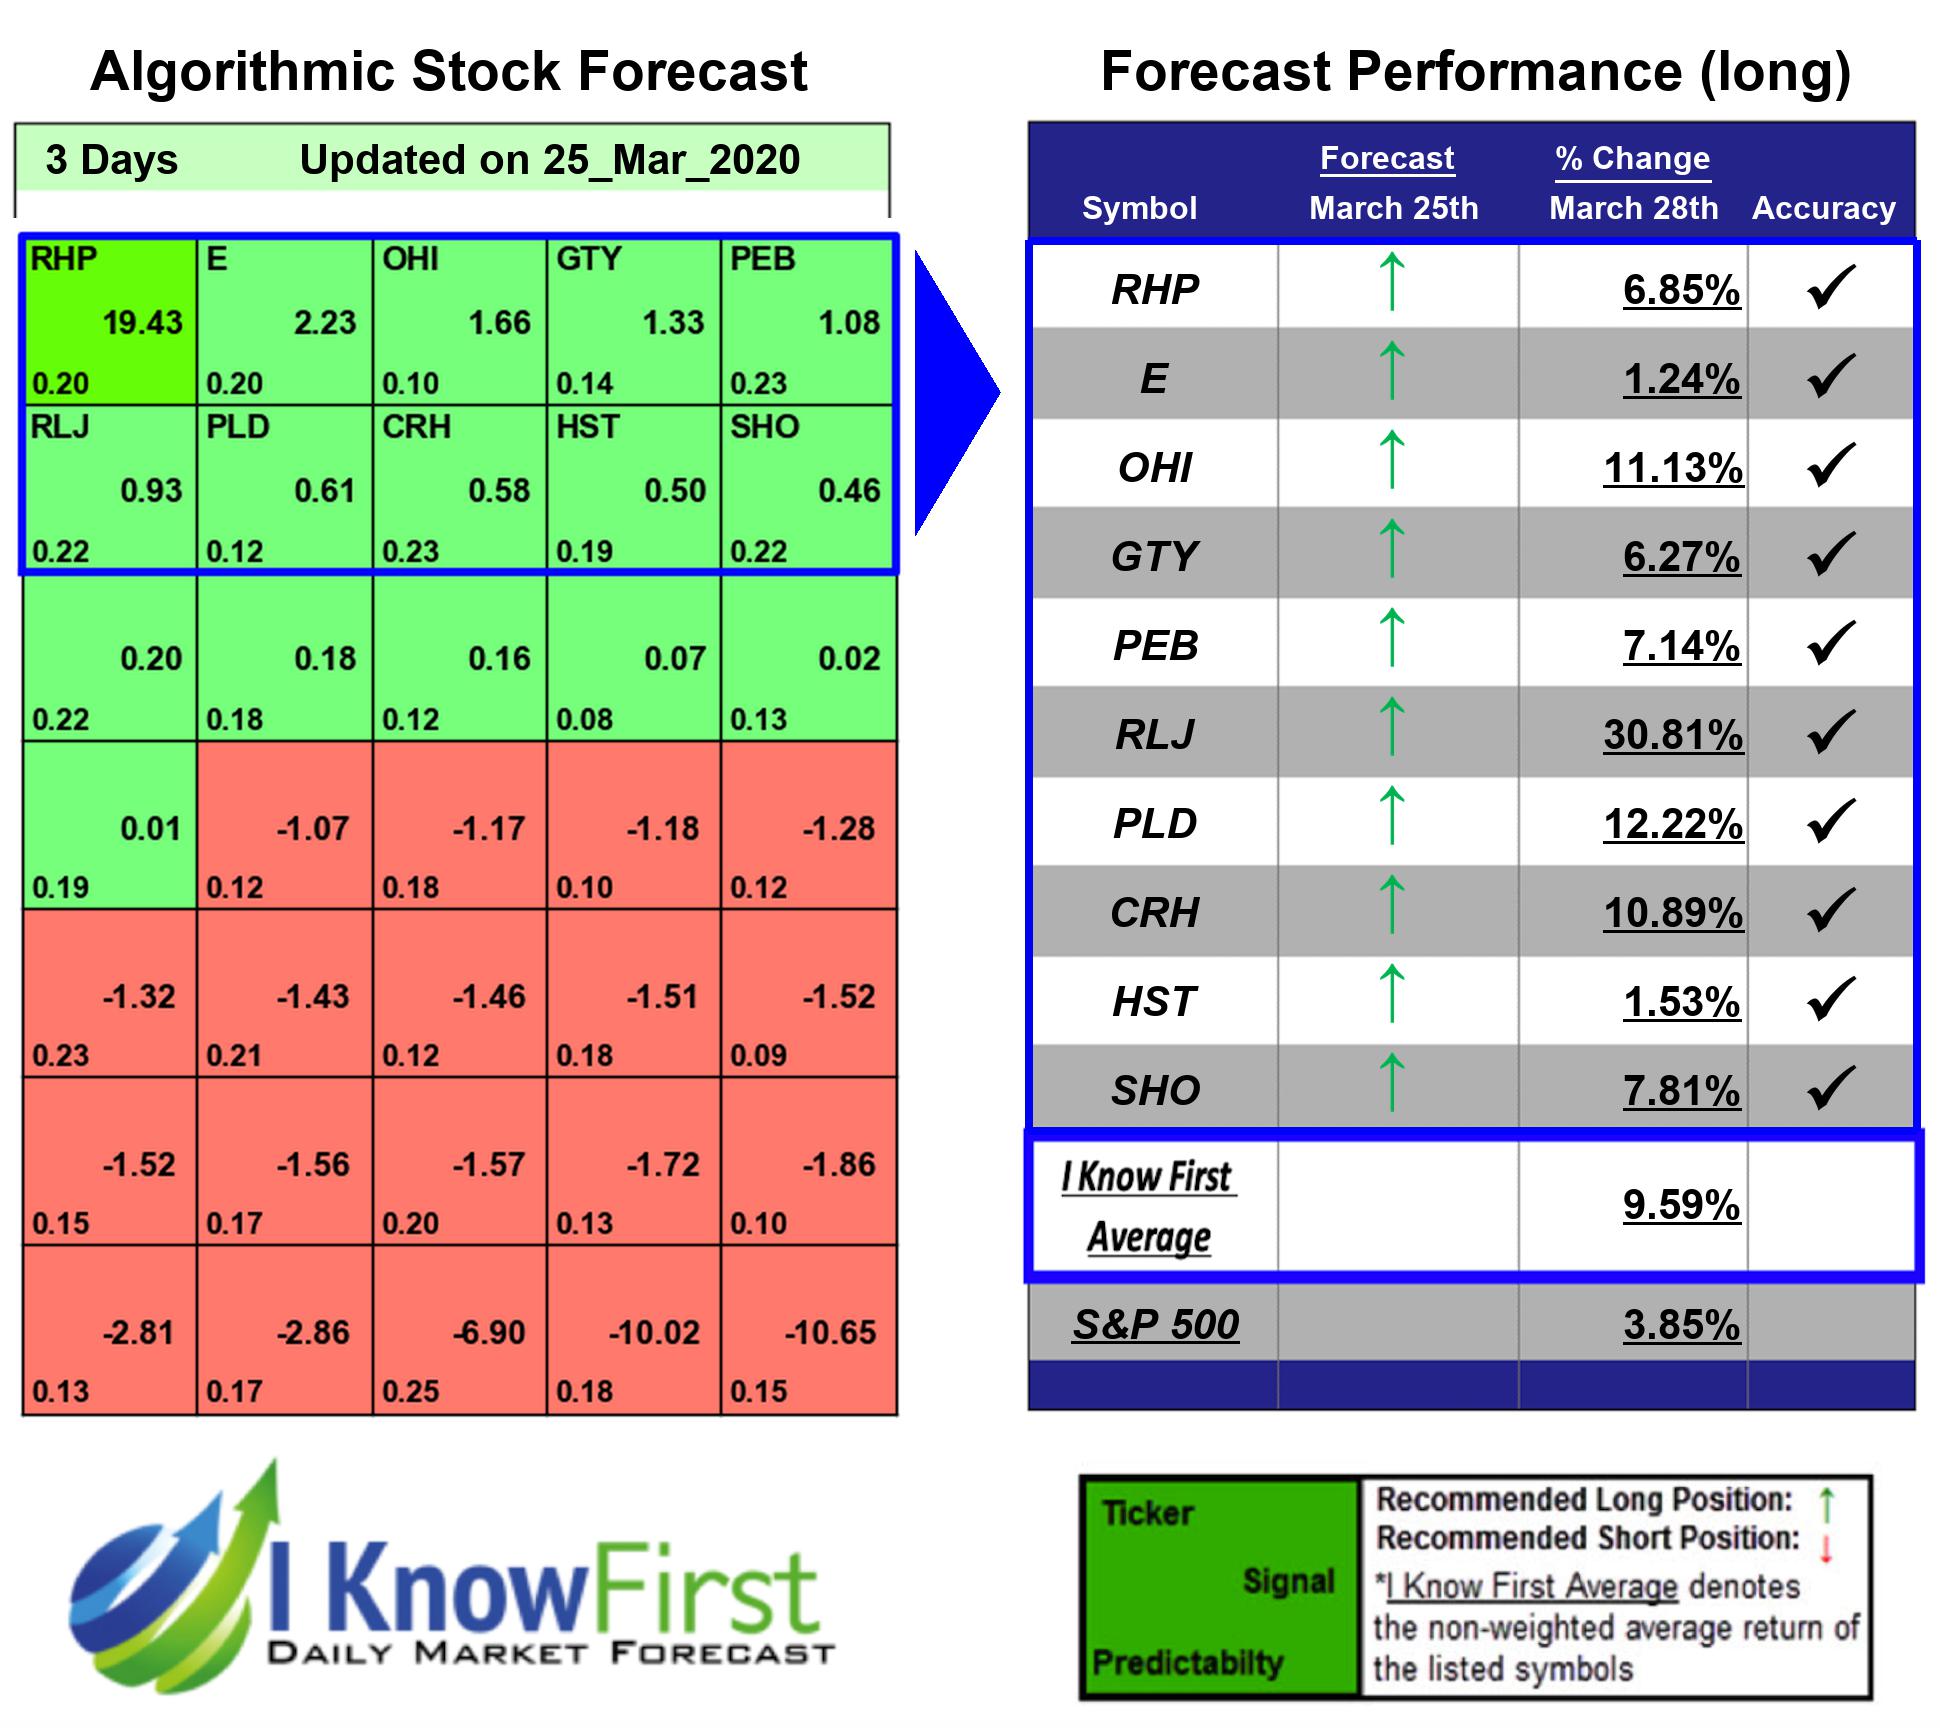
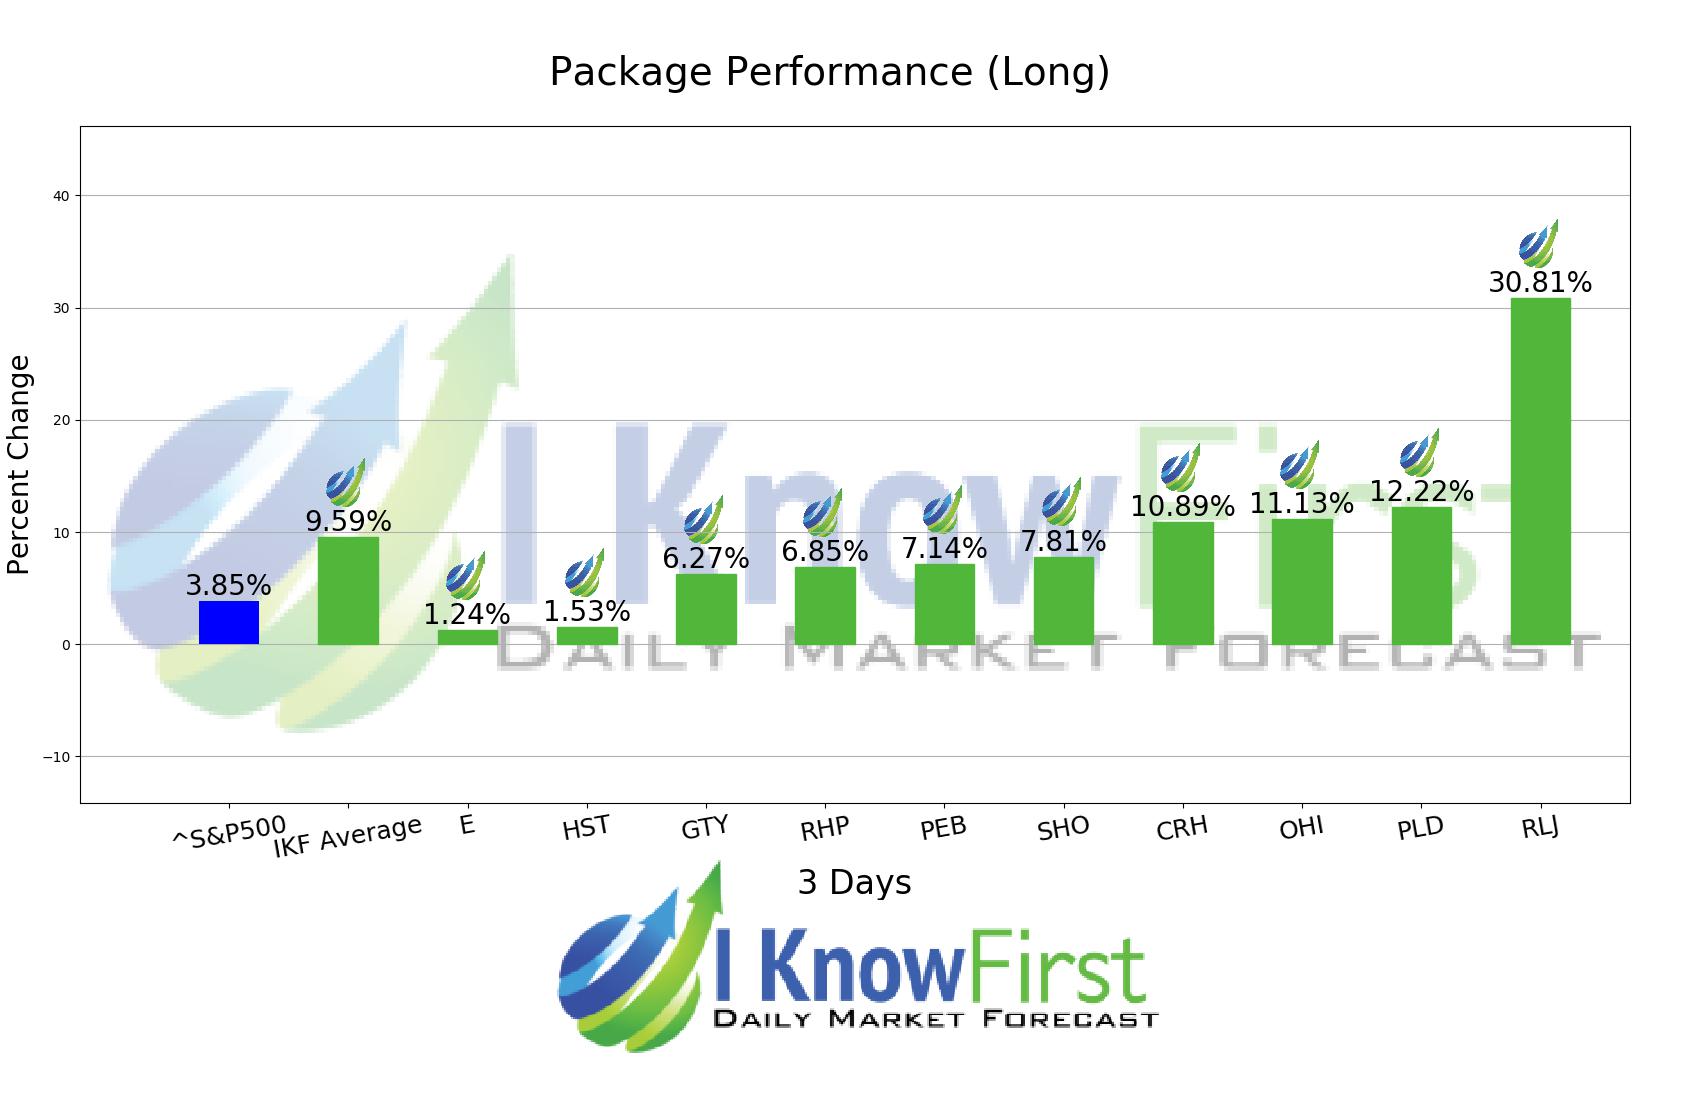
During the 3 Days forecasted period several picks in the Real Estate Stock Forecast Package saw significant returns. The algorithm had correctly predicted 10 out 10 returns. RLJ was the highest-earning trade with a return of 30.81% in 3 Days. Other notable stocks were PLD and OHI with a return of 12.22% and 11.13%. The package itself saw an overall return of 9.59%, providing investors with a 5.74% premium above the S&P 500’s return of 3.85% for the same time period.
RLJ Lodging Trust (RLJ) is an independent equity real estate investment trust. The firm also manages real estate funds. It invests in the real estate markets of the United States. The firm primarily invests in premium-branded, focused service, and compact full-service hotels. RLJ Lodging Trust (RLJ) was launched in 2000 and is domiciled in Bethesda, Maryland.
Algorithmic traders utilize these daily forecasts by the I Know First market prediction system as a tool to enhance portfolio performance, verify their own analysis and act on market opportunities faster. This forecast was sent to current I Know First subscribers.
How to interpret this diagram
Algorithmic Stock Forecast: The table on the left is a stock forecast produced by I Know First’s algorithm. Each day, subscribers receive forecasts for six different time horizons. Note that the top 10 stocks in the 1-month forecast may be different than those in the 1-year forecast. In the included table, only the relevant stocks have been included. The boxes are arranged according to their respective signal and predictability values (see below for detailed definitions). A green box represents a positive forecast, suggesting a long position, while a red represents a negative forecast, suggesting a short position.
Please note-for trading decisions use the most recent forecast. Get today’s forecast and Top stock picks.


