
Best Mid Cap Stocks Based on Pattern Recognition: Returns up to 5.59% in 3 Days
Best Mid Cap Stocks
This Best Mid Cap Stocks forecast is designed for investors and analysts who need predictions for the best companies with market capitalization between USD 500m and USD 50b. It includes 20 stocks with bullish and bearish signals:
- Top 10 Mid Cap stocks for the long position
- Top 10 Mid Cap stocks for the short position
Package Name: Best Mid Cap Stocks
Recommended Positions: Long
Forecast Length: 3 Days (8/7/2020 – 8/11/2020)
I Know First Average: 2.54%
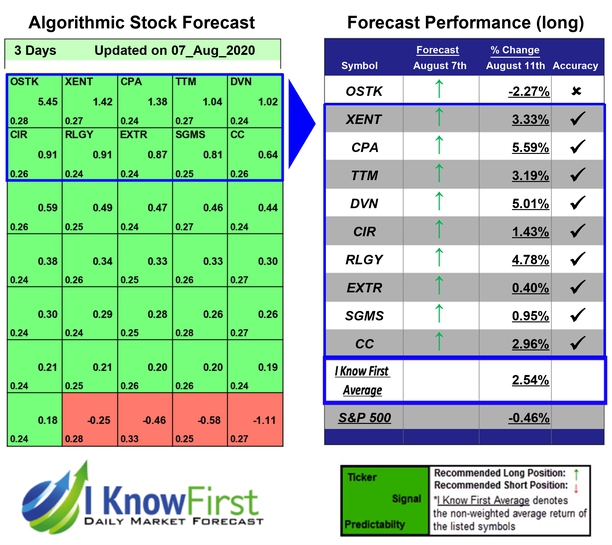
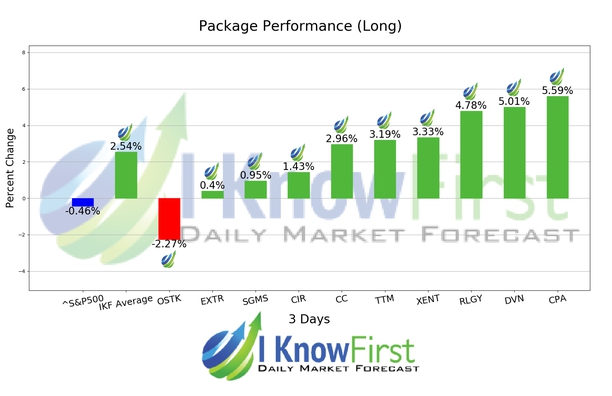
Several predictions in this 3 Days forecast saw significant returns. The algorithm had correctly predicted 9 out 10 stock movements. CPA was the top performing prediction with a return of 5.59%. DVN and RLGY saw outstanding returns of 5.01% and 4.78%. This algorithmic forecast package presented an overall return of 2.54% versus S&P 500’s performance of -0.46% providing a market premium of 3.00%.
Copa Holdings, S.A. (CPA), through its subsidiaries, provides airline passenger and cargo services in Latin America. It offers services within Colombia; and international flights from various cities in Colombia to Panama, Venezuela, Ecuador, México, Cuba, Guatemala, and Costa Rica. The company offers approximately 360 daily scheduled flights among 73 destinations in 31 countries in North, Central, and South America, as well as the Caribbean from its Panama City hub. As of December 2015, it operated a fleet of 100 aircraft comprising 14 Boeing 737-700 next generation aircraft, 63 Boeing 737-800 next generation aircraft, and 23 Embraer 190 aircraft. The company has a strategic alliance with United Continental Holdings, Inc. Copa Holdings, S.A. (CPA) was founded in 1947 and is based in Panama City, Panama.
Algorithmic traders utilize these daily forecasts by the I Know First market prediction system as a tool to enhance portfolio performance, verify their own analysis and act on market opportunities faster. This forecast was sent to current I Know First subscribers.
How to interpret this diagram
Algorithmic Stock Forecast: The table on the left is a stock forecast produced by I Know First’s algorithm. Each day, subscribers receive forecasts for six different time horizons. Note that the top 10 stocks in the 1-month forecast may be different than those in the 1-year forecast. In the included table, only the relevant stocks have been included. The boxes are arranged according to their respective signal and predictability values (see below for detailed definitions). A green box represents a positive forecast, suggesting a long position, while a red represents a negative forecast, suggesting a short position.
Please note-for trading decisions use the most recent forecast. Get today’s forecast and Top stock picks.


