
Best Mid Cap Stocks Based on Big Data: Returns up to 36.09% in 3 Months
Best Mid Cap Stocks
This Best Mid Cap Stocks forecast is designed for investors and analysts who need predictions for the best companies with market capitalization between USD 500m and USD 50b. It includes 20 stocks with bullish and bearish signals:
- Top 10 Mid Cap stocks for the long position
- Top 10 Mid Cap stocks for the short position
Package Name: Best Mid Cap Stocks
Recommended Positions: Long
Forecast Length: 3 Months (11/17/20 – 2/17/21)
I Know First Average: 18.99%

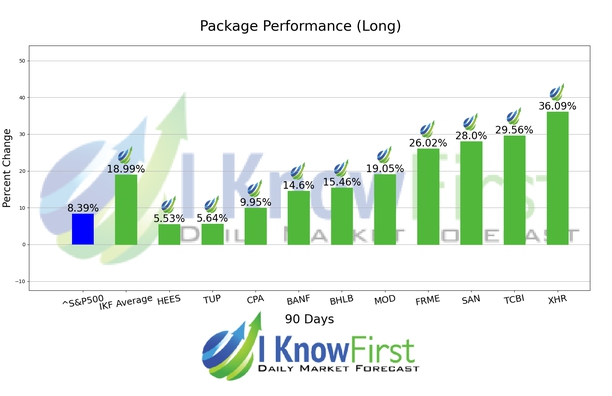
The algorithm correctly predicted 10 out 10 of the suggested trades in the Best Mid Cap Stocks Package for this 3 Months forecast. XHR was our best stock pick this week a return of 36.09%. Additional high returns came from TCBI and SAN, at 29.56% and 28.0% respectively. With these notable trade returns, the package itself registered an average return of 18.99% compared to the S&P 500’s return of 8.39% for the same period.
Xenia Hotels & Resorts, Inc. (XHR) operates as a self-advised and self-administered real estate investment trust (REIT) that invests in full service hotels in the United States. As of February 23, 2016, it owned 50 hotels comprising 12,548 rooms across 21 states and the District of Columbia. The company has elected to be taxed as a REIT and would not be subject to federal corporate income taxes if it distributes at least 90% of its taxable income to its stockholders. Xenia Hotels & Resorts, Inc. (XHR) is headquartered in Orlando, Florida.
Algorithmic traders utilize these daily forecasts by the I Know First market prediction system as a tool to enhance portfolio performance, verify their own analysis and act on market opportunities faster. This forecast was sent to current I Know First subscribers.
How to interpret this diagram
Algorithmic Stock Forecast: The table on the left is a stock forecast produced by I Know First’s algorithm. Each day, subscribers receive forecasts for six different time horizons. Note that the top 10 stocks in the 1-month forecast may be different than those in the 1-year forecast. In the included table, only the relevant stocks have been included. The boxes are arranged according to their respective signal and predictability values (see below for detailed definitions). A green box represents a positive forecast, suggesting a long position, while a red represents a negative forecast, suggesting a short position.
Please note-for trading decisions use the most recent forecast. Get today’s forecast and Top stock picks.


