Best Insurance Stocks Based on Predictive Analytics: Returns up to 38.28% in 7 Days
Best Insurance Stocks
The Insurance Companies Package is designed for investors and analysts who need stock advice for the best-performing stocks in the Insurance Company Industry. It includes 20 stocks with bullish and bearish signals and indicates the best insurance companies’ stocks to trade:
- Top 10 Insurance Company stocks for the long position
- Top 10 Insurance Company stocks for the short position

Package Name: Insurance Companies Forecast
Recommended Positions: Long
Forecast Length: 7 Days (8/27/2020 – 9/3/2020)
I Know First Average: 3.85%
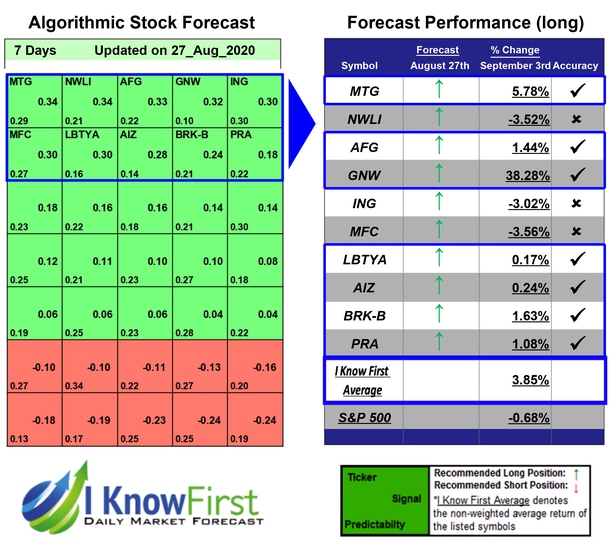

I Know First’s State of the Art Algorithm accurately forecasted 7 out of 10 trades in this Insurance Companies Forecast Package for the 7 Days time period. GNW was the top performing prediction with a return of 38.28%. The suggested trades for MTG and BRK-B also had notable 7 Days yields of 5.78% and 1.63%, respectively. The package had an overall average return of 3.85%, providing investors with a premium of 4.53% over the S&P 500’s return of -0.68% during the same period.
Genworth Financial, Inc. (GNW) provides insurance and homeownership solutions in the United States and internationally. It operates through five segments: U.S. Mortgage Insurance, Canada Mortgage Insurance, Australia Mortgage Insurance, U.S. Life Insurance, and Runoff.
Algorithmic traders utilize these daily forecasts by the I Know First market prediction system as a tool to enhance portfolio performance, verify their own analysis and act on market opportunities faster. This forecast was sent to current I Know First subscribers.
How to interpret this diagram
Algorithmic Stock Forecast: The table on the left is a stock forecast produced by I Know First’s algorithm. Each day, subscribers receive forecasts for six different time horizons. Note that the top 10 stocks in the 1-month forecast may be different than those in the 1-year forecast. In the included table, only the relevant stocks have been included. The boxes are arranged according to their respective signal and predictability values (see below for detailed definitions). A green box represents a positive forecast, suggesting a long position, while a red represents a negative forecast, suggesting a short position.
Please note-for trading decisions use the most recent forecast. Get today’s forecast and Top stock picks.