
Best Indian Stocks Based on Big Data Analytics: Returns up to 60.06% in 1 Month
Best Indian Stocks
Top Performing Indian Stocks: This forecast is part of the By Country Package, as one of I Know First’s algorithmic trading tools. The full forecast includes daily predictions for a total of 20 stocks with bullish and bearish signals:
- Top 10 Indian stocks for the long position
- Top 10 Indian stocks for the short position
Package Name: By Country – Indian Stocks
Recommended Positions: Long
Forecast Length: 1 Month (12/13/20 – 1/13/21)
I Know First Average: 13.51%
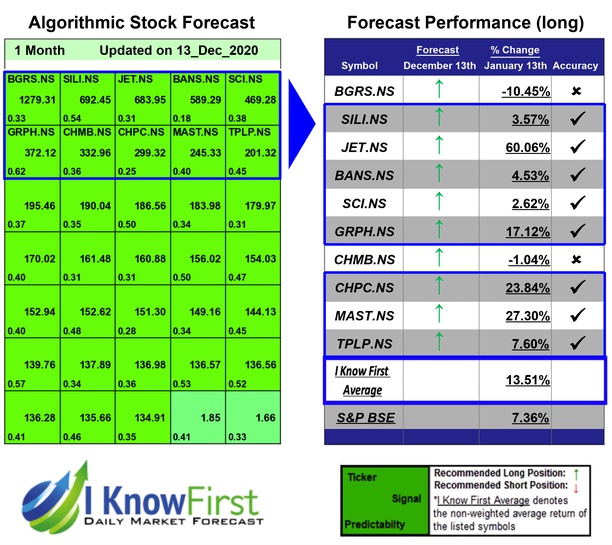
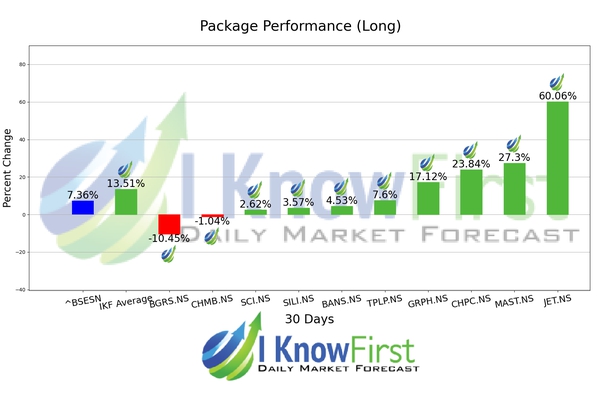
Several predictions in this 1 Month forecast saw significant returns. The algorithm had correctly predicted 8 out 10 stock movements. The top-performing prediction in this forecast was JET.NS, which registered a return of 60.06%. The suggested trades for MAST.NS and CHPC.NS also had notable 1 Month yields of 27.3% and 23.84%, respectively. The package had an overall average return of 13.51%, providing investors with a 6.15% premium over the S&P BSE’s return of 7.36% during the period.
05.7K2017226.9K2018245.1K2019(E)261.3KEPS (INR)201693.630201738.6002018-56.0302019(E)-309.833Price To Earnings (TTM)–Price To Sales (TTM)0.05Price To Book (MRQ)–Price To Cash Flow (TTM)3.43Total Debt To Equity (MRQ)–LT Debt To Equity (MRQ)–Return on Investment (TTM)–Return on Equity (TTM)–
Algorithmic traders utilize these daily forecasts by the I Know First market prediction system as a tool to enhance portfolio performance, verify their own analysis and act on market opportunities faster. This forecast was sent to current I Know First subscribers.
How to interpret this diagram
Algorithmic Stock Forecast: The table on the left is a stock forecast produced by I Know First’s algorithm. Each day, subscribers receive forecasts for six different time horizons. Note that the top 10 stocks in the 1-month forecast may be different than those in the 1-year forecast. In the included table, only the relevant stocks have been included. The boxes are arranged according to their respective signal and predictability values (see below for detailed definitions). A green box represents a positive forecast, suggesting a long position, while a red represents a negative forecast, suggesting a short position.
Please note-for trading decisions use the most recent forecast. Get today’s forecast and Top stock picks.


