
Best Hedge Fund Stocks Based on a Self-learning Algorithm: Returns up to 214.6% in 1 Year
Best Hedge Fund Stocks
This Hedge Fund Stocks Package is designed for investors and analysts who need predictions of the best-performing stocks according to I Know First’s stock market algorithm. It includes 20 stocks with bullish and bearish signals and indicates the best stocks to long and short based on artificial intelligence trading strategies:
- Top 10 Hedge Fund stocks for the long position
- Top 10 Hedge Fund stocks for the short position

Package Name: Hedge Fund Stocks
Recommended Positions: Long
Forecast Length: 1 Year (12/9/2018 – 12/9/2019)
I Know First Average: 51.82%

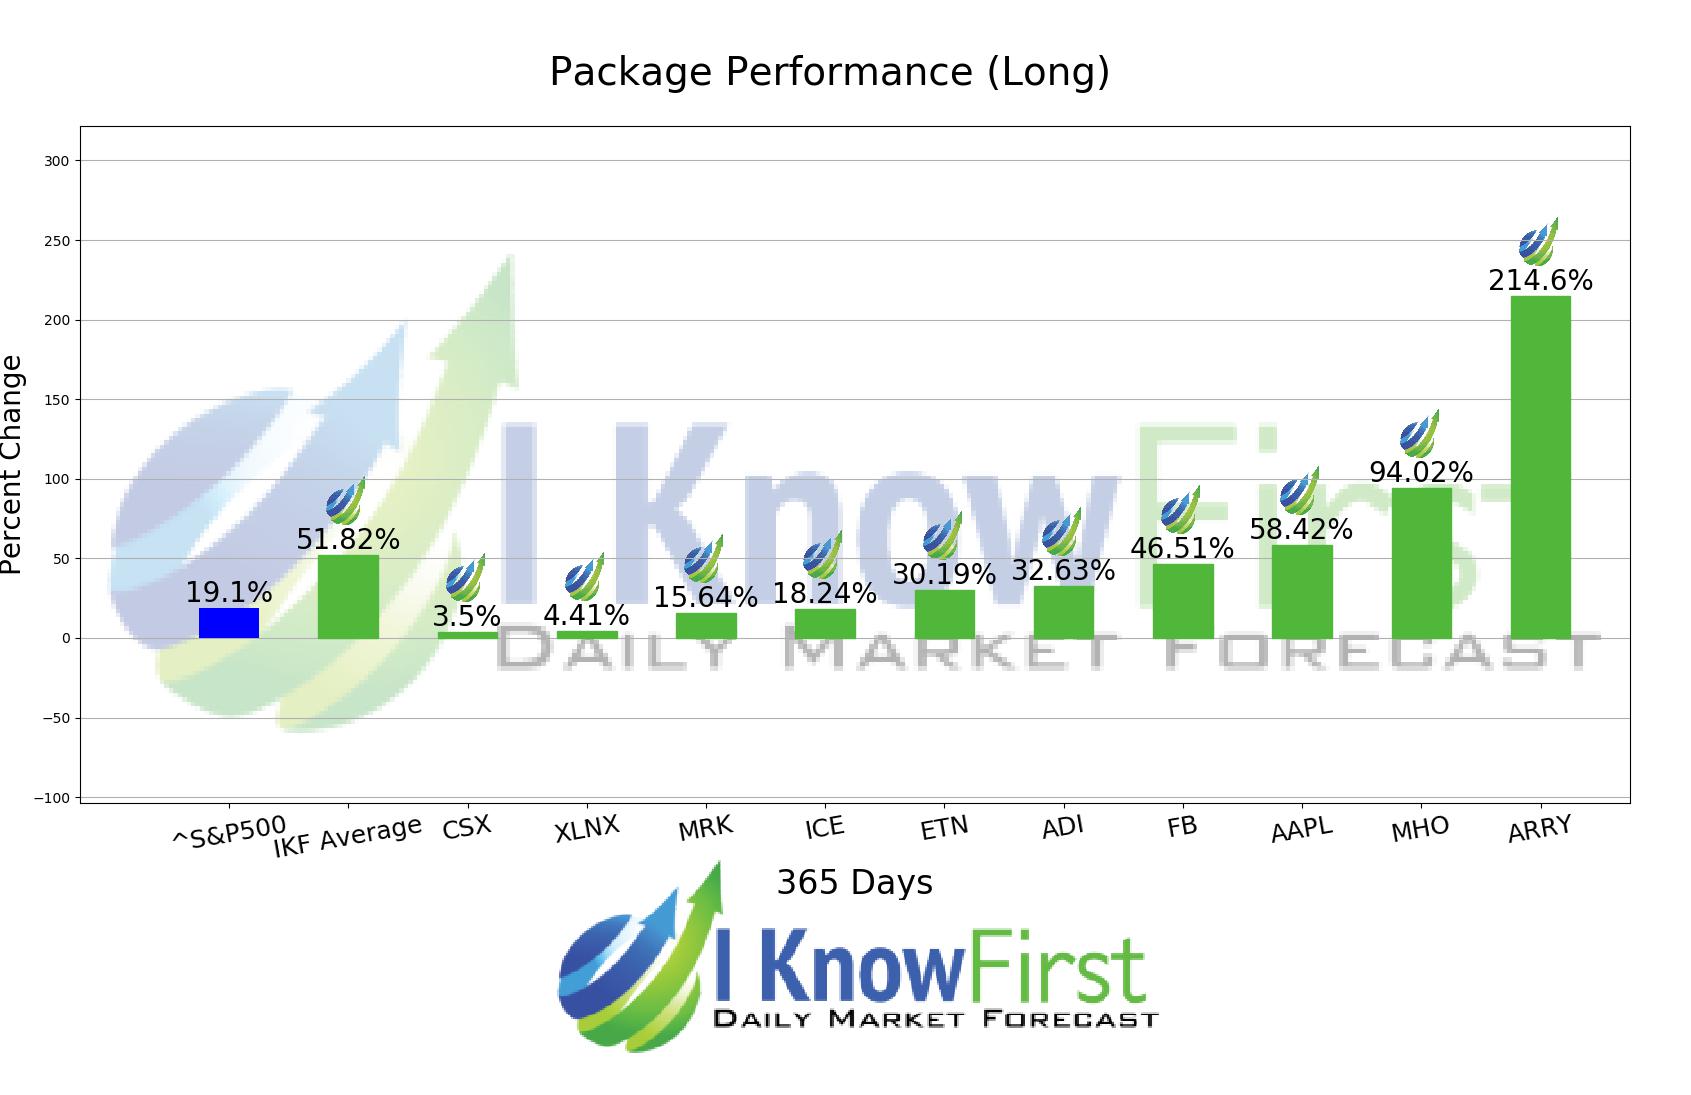
Several predictions in this 1 Year forecast saw significant returns. The algorithm had correctly predicted 10 out 10 stock movements. The greatest return came from ARRY at 214.6%. MHO and AAPL also performed well for this time horizon with returns of 94.02% and 58.42%, respectively. The overall average return in this Hedge Fund Stocks package was 51.82%, providing investors with a 32.72% premium over the S&P 500’s return of 19.1% during the same period.
Array BioPharma Inc. (ARRY) is a biopharmaceutical company, that is involved in discovery research and drug creation. The Company provides drug discovery products and services to create, evaluate, and optimize potential drug candidates in collaboration with pharmaceutical and other biotechnology companies.
Algorithmic traders utilize these daily forecasts by the I Know First market prediction system as a tool to enhance portfolio performance, verify their own analysis and act on market opportunities faster. This forecast was sent to current I Know First subscribers.
How to interpret this diagram
Algorithmic Stock Forecast: The table on the left is a stock forecast produced by I Know First’s algorithm. Each day, subscribers receive forecasts for six different time horizons. Note that the top 10 stocks in the 1-month forecast may be different than those in the 1-year forecast. In the included table, only the relevant stocks have been included. The boxes are arranged according to their respective signal and predictability values (see below for detailed definitions). A green box represents a positive forecast, suggesting a long position, while a red represents a negative forecast, suggesting a short position.
Please note-for trading decisions use the most recent forecast. Get today’s forecast and Top stock picks.


