Best European Stocks: Daily Forecast Performance Evaluation Report
Executive Summary
In this stock market forecast evaluation report, we will examine the performance of the forecasts generated by the I Know First AI Algorithm for European stocks which were daily sent to our customers. Our analysis covers the time period from 23 November, 2018 to 23 February, 2020.


Best European Stocks Evaluation Highlights:
- Stocks forecasts that were generated by our Daily Forecast Model obtained positive returns for all time horizons.
- I Know First succeed to beat Euronext 100 in most time horizons.
- Every signal group has hit ratios of more than 50% for all time horizons.
The above results were obtained based on the stock market forecast evaluation over the specific time period using a consecutive filtering approach – by predictability and then by signal, to give a general overview of the forecasting capabilities of the algorithm for specific stock universe.
About the I Know First Algorithm

The I Know First self-learning algorithm analyzes, models, and predicts the capital market, including stocks, bonds, currencies, commodities and interest rates markets. The algorithm is based on Artificial Intelligence (AI) and Machine Learning (ML) and incorporates elements of Artificial Neural Networks and Genetic Algorithms.
The I Know First Market Prediction System models and predicts the flow of money between the markets. It separates the predictable information from any “random noise”. It then creates a model that projects the future trajectory of the given market in the multidimensional space of other markets.
Since the model is 100% empirical, the results are based only on factual data, thereby avoiding any biases or emotions that may accompany human derived assumptions. The human factor is only involved in building the mathematical framework and providing the initial set of inputs and outputs to the system. The algorithm produces a stock market forecast with a signal and a predictability indicator. The signal is the number in the middle of the box. The predictability is the number at the bottom of the box. At the top, a specific asset is identified. This format is consistent across all predictions.
Our algorithm provides two independent indicators for each asset – signal and predictability. The signal is the predicted strength and direction of the asset’s movement. This is measured from -inf to +inf. The predictability indicates our confidence in that result. It is a Pearson correlation coefficient between past algorithmic performance and actual market movement. This is measured from -1 to 1.
A detailed description of our heatmap can be found here.
Evaluating European Stocks: The Stock Picking Method
The Daily Forecast Model
We take the top 30 most predictable assets, and then we apply a set of signal-based filters: top 20, 10 and 5 based on predictability.
By doing so we focus on the most predictable assets on the one hand, while capturing the ones with the highest signal on the other.
We use absolute signals since these strategies are long and short ones. If the signal is positive, then we buy and, if negative, we short.
For example, a top 30 predictability filter with a top 10 signal filter means that on each day we take only the 30 most predictable assets, and then we pick from them the top 10 assets with the highest absolute signals.
The Stock Market Forecast Performance Evaluation Method
We perform a stock market forecast evaluation on the individual forecast level. This means that we calculate the return of each forecast we have issued for each horizon in the testing period. We then take the average of those results by strategy and forecast horizon.
For example, to evaluate the performance of our 1-month forecasts, we calculate the return of each trade by using this formula:
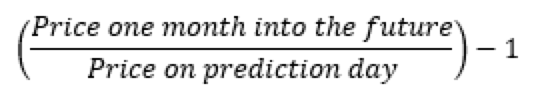
This simulates a client purchasing the asset on the day we issue our prediction and selling it exactly 1 month in the future from that day.
We iterate this calculation for all trading days in the analyzed period and average the results.
Note that this stock forecast evaluation does not take a set portfolio and follow it. This is a different stock forecast evaluation method at the individual forecast level.
The Hit Ratio Method
The hit ratio helps us to identify the accuracy of our algorithm’s predictions.
Using our Daily Forecast asset filtering, we predict the direction of movement of different assets. Our predictions are then compared against actual movements of these assets within the same time horizon.
The hit ratio is then calculated as follows:

For instance, a 90% hit ratio for a top 30 predictability filter with a top 10 signal filter would imply that the algorithm correctly predicted the price movements of 9 out of 10 assets within this particular set of assets.
The Benchmarking Method – Euronext 100 Index
In order to evaluate our algorithm’s performance in comparison to the European stock market, we used Euronext 100 index (^N100) as a benchmark.
Euronext 100 is a stock market index which groups together the securities with the highest capital and which are actively negotiated on Euronext. Companies such as BNP Paribas, Carrefour and even ArcelorMittal are regularly included in this stock market index. The composition of Euronext 100 is updated every 3 months. The stocks in the Euronext 100 Index represent 80% of the total market capitalization of Euronext’s investment universe. For each time horizon, we compare the Euronext 100 performance with the performance of our forecasts after the filtering processes described above.
Top European Stocks Results: Average Return and Hit Ratio

As can be seen above, by applying the top 30 predictability-based filtering method, we achieved positive returns for all time horizons. The best performance was observed for 14-day time horizon with a return of 0.86%. Thereby we beat Euronext 100 for most time horizons. Those results indicate that the signal effect on forecast average return is fairly consistent.

Hit ratios were higher than 50% accuracy for all time horizons. That means the accuracy is good. We can observe that the Hit Ratios are more or less equivalent.
Conclusion
This evaluation report presented the performance of I Know First’s algorithm for European Stocks showing the average returns for all time horizons after the relevant filtering processes. The analysis demonstrates the efficacy of the Daily Forecast Model which forecasted assets groups having positive average returns for every time horizon. For most time horizons, I Know First had a higher a average return than Euronext 100.
According to this algorithm performance analysis for the European stock market, all investment according to these signals were profitable. I Know First’s research team will continue to monitor the changes in the performance trends of both models in order to evaluate our algorithm’s performance and derive relevant insights that will help provide the best algorithmic trading solutions to our clients.