Best European Stocks Based on Pattern Recognition: Returns up to 39.43% in 3 Months
Best European Stocks
This European Stocks forecast is part of the By Region Package, as one of I Know First’s algorithmic trading tools. The full forecast includes daily predictions for a total of 20 best European stocks based on artificial intelligence with bullish and bearish signals:
- Top 10 European stocks for the long position
- Top 10 European stocks for the short position
Package Name: By Region – European Stocks
Recommended Positions: Long
Forecast Length: 3 Months (8/16/2020 – 11/17/2020)
I Know First Average: 21.06%
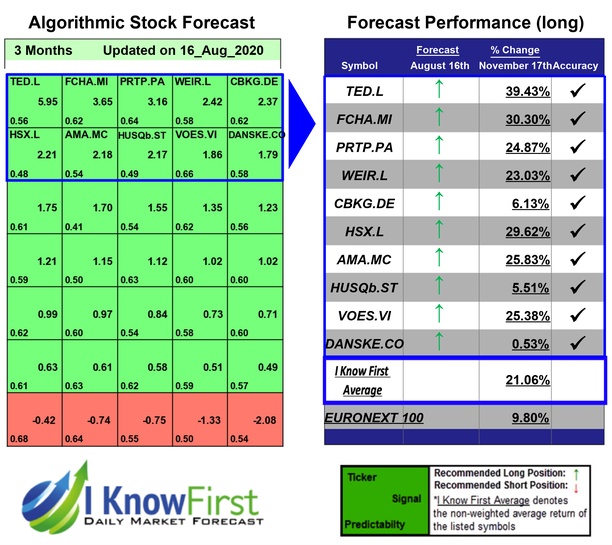
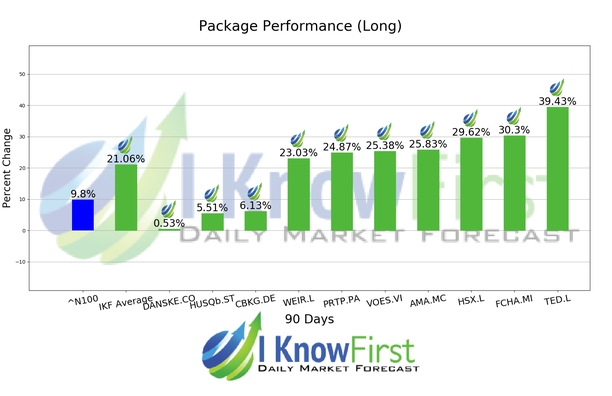
For this 3 Months forecast the algorithm had successfully predicted 10 out of 10 movements. The highest trade return came from TED.L, at 39.43%. FCHA.MI, and HSX.L had notable returns of 30.3% and 29.62%. The package had an overall average return of 21.06%, providing investors with a 11.26% premium over the Euronext 100 return of 9.8% during the period.
nalystsSellHoldBuyRevenue (MM, GBP)20180.6K20190.6K20200.6K2021(E)0.4KEPS (GBp)2018126.9002019114.200202022.0002021(E)-34.698Price To Earnings (TTM)–Price To Sales (TTM)0.34Price To Book (MRQ)0.43Price To Cash Flow (TTM)–Total Debt To Equity (MRQ)234.36LT Debt To Equity (MRQ)88.78Return on Investment (TTM)-25.12Return on Equity (TTM)-12.96
Algorithmic traders utilize these daily forecasts by the I Know First market prediction system as a tool to enhance portfolio performance, verify their own analysis and act on market opportunities faster. This forecast was sent to current I Know First subscribers.
How to interpret this diagram
Algorithmic Stock Forecast: The table on the left is a stock forecast produced by I Know First’s algorithm. Each day, subscribers receive forecasts for six different time horizons. Note that the top 10 stocks in the 1-month forecast may be different than those in the 1-year forecast. In the included table, only the relevant stocks have been included. The boxes are arranged according to their respective signal and predictability values (see below for detailed definitions). A green box represents a positive forecast, suggesting a long position, while a red represents a negative forecast, suggesting a short position.
Please note-for trading decisions use the most recent forecast. Get today’s forecast and Top stock picks.