
Best ETF To Buy Based on Deep-Learning: Returns up to 3.05% in 7 Days
Best ETF To Buy
This Best ETF To Buy forecast is part of the ETFs Package, as one of I Know First’s quantitative investment solutions. We determine the top ETFs by screening our database daily using our advanced algorithm. The full ETFs Package includes a daily forecast for a total of 20 ETFs with bullish and bearish signals:
- Top 10 ETFs for the long position
- Top 10 ETFs for the short position
Package Name: ETFs Forecast
Recommended Positions: Long
Forecast Length: 7 Days (4/11/21 – 4/19/21)
I Know First Average: 1.27%

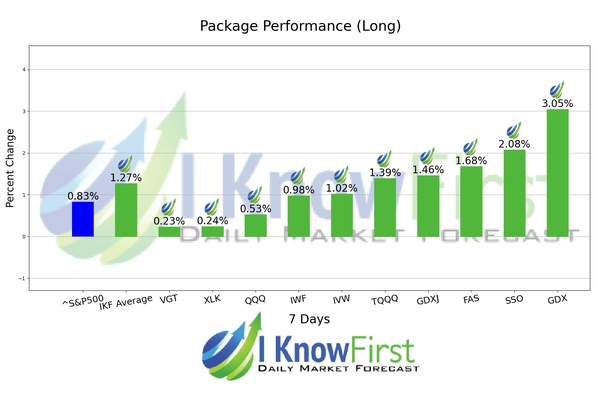
During the 7 Days forecasted period several picks in the ETFs Forecast Package saw significant returns. The algorithm had correctly predicted 10 out 10 returns. GDX was the highest-earning trade with a return of 3.05% in 7 Days. Further notable returns came from SSO and FAS at 2.08% and 1.68%, respectively. The package had an overall average return of 1.27%, providing investors with a 0.44% premium over the S&P 500’s return of 0.83% during the period.
VanEck Vectors Gold Miners ETF (GDX), is an ETF investment fund that seeks to replicate, before fees and expenses, the price and yield performance of the NYSE Arca Gold Miners Index. The fund normally invests at least 80% of its total assets in common stocks and depositary receipts of companies involved in the gold mining industry.
Algorithmic traders utilize these daily forecasts by the I Know First market prediction system as a tool to enhance portfolio performance, verify their own analysis and act on market opportunities faster. This forecast was sent to current I Know First subscribers.
How to interpret this diagram
Algorithmic Stock Forecast: The table on the left is a stock forecast produced by I Know First’s algorithm. Each day, subscribers receive forecasts for six different time horizons. Note that the top 10 stocks in the 1-month forecast may be different than those in the 1-year forecast. In the included table, only the relevant stocks have been included. The boxes are arranged according to their respective signal and predictability values (see below for detailed definitions). A green box represents a positive forecast, suggesting a long position, while a red represents a negative forecast, suggesting a short position.
Please note-for trading decisions use the most recent forecast. Get today’s forecast and Top stock picks.


