
Best Energy Stocks Based on Deep-Learning: Returns up to 69.65% in 1 Month
Best Energy Stocks
The Energy Stocks Package is based on the I Know First algorithm and is designed for investors and analysts who need recommendations for the best performing stocks for the whole Energy Industry. It includes 20 stocks with bullish and bearish signals and indicates the best stocks to buy and sell:
- Top 10 Energy stocks for the long position
- Top 10 Energy stocks for the short position

Package Name: Energy Stocks Forecast
Recommended Positions: Long
Forecast Length: 1 Month (12/15/20 – 1/15/21)
I Know First Average: 24.74%

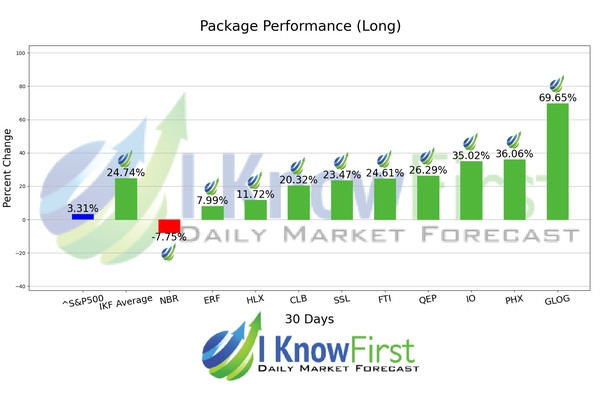
In this 1 Month forecast for the Energy Stocks Forecast Package, there were many high performing trades and the algorithm correctly predicted 9 out 10 trades. The top performing prediction from this package was GLOG with a return of 69.65%. Other notable stocks were PHX and IO with a return of 36.06% and 35.02%. The package had an overall average return of 24.74%, providing investors with a 21.43% premium over the S&P 500’s return of 3.31% during the period.
GasLog Ltd., together with its subsidiaries, engages in the ownership, operation, and management of vessels in the liquefied natural gas (LNG) market worldwide. It provides maritime services for the transportation of LNG; and LNG vessel management services. The company manages and operates a fleet of 22 LNG carriers, including 17 own LNG carriers, as well as 5 LNG carriers for technical ship management services owned by third parties. GasLog Ltd. was incorporated in 2003 and is based in Monaco.
Algorithmic traders utilize these daily forecasts by the I Know First market prediction system as a tool to enhance portfolio performance, verify their own analysis and act on market opportunities faster. This forecast was sent to current I Know First subscribers.
How to interpret this diagram
Algorithmic Stock Forecast: The table on the left is a stock forecast produced by I Know First’s algorithm. Each day, subscribers receive forecasts for six different time horizons. Note that the top 10 stocks in the 1-month forecast may be different than those in the 1-year forecast. In the included table, only the relevant stocks have been included. The boxes are arranged according to their respective signal and predictability values (see below for detailed definitions). A green box represents a positive forecast, suggesting a long position, while a red represents a negative forecast, suggesting a short position.
Please note-for trading decisions use the most recent forecast. Get today’s forecast and Top stock picks.


