
Best Energy Stocks Based on Deep Learning: Returns up to 228.3% in 1 Month
Best Energy Stocks
The Energy Stocks Package is based on the I Know First algorithm and is designed for investors and analysts who need recommendations for the best performing stocks for the whole Energy Industry. It includes 20 stocks with bullish and bearish signals and indicates the best stocks to buy and sell:
- Top 10 Energy stocks for the long position
- Top 10 Energy stocks for the short position

Package Name: Energy Stocks Forecast
Recommended Positions: Long
Forecast Length: 1 Month (5/8/2020 – 6/8/2020)
I Know First Average: 87.46%
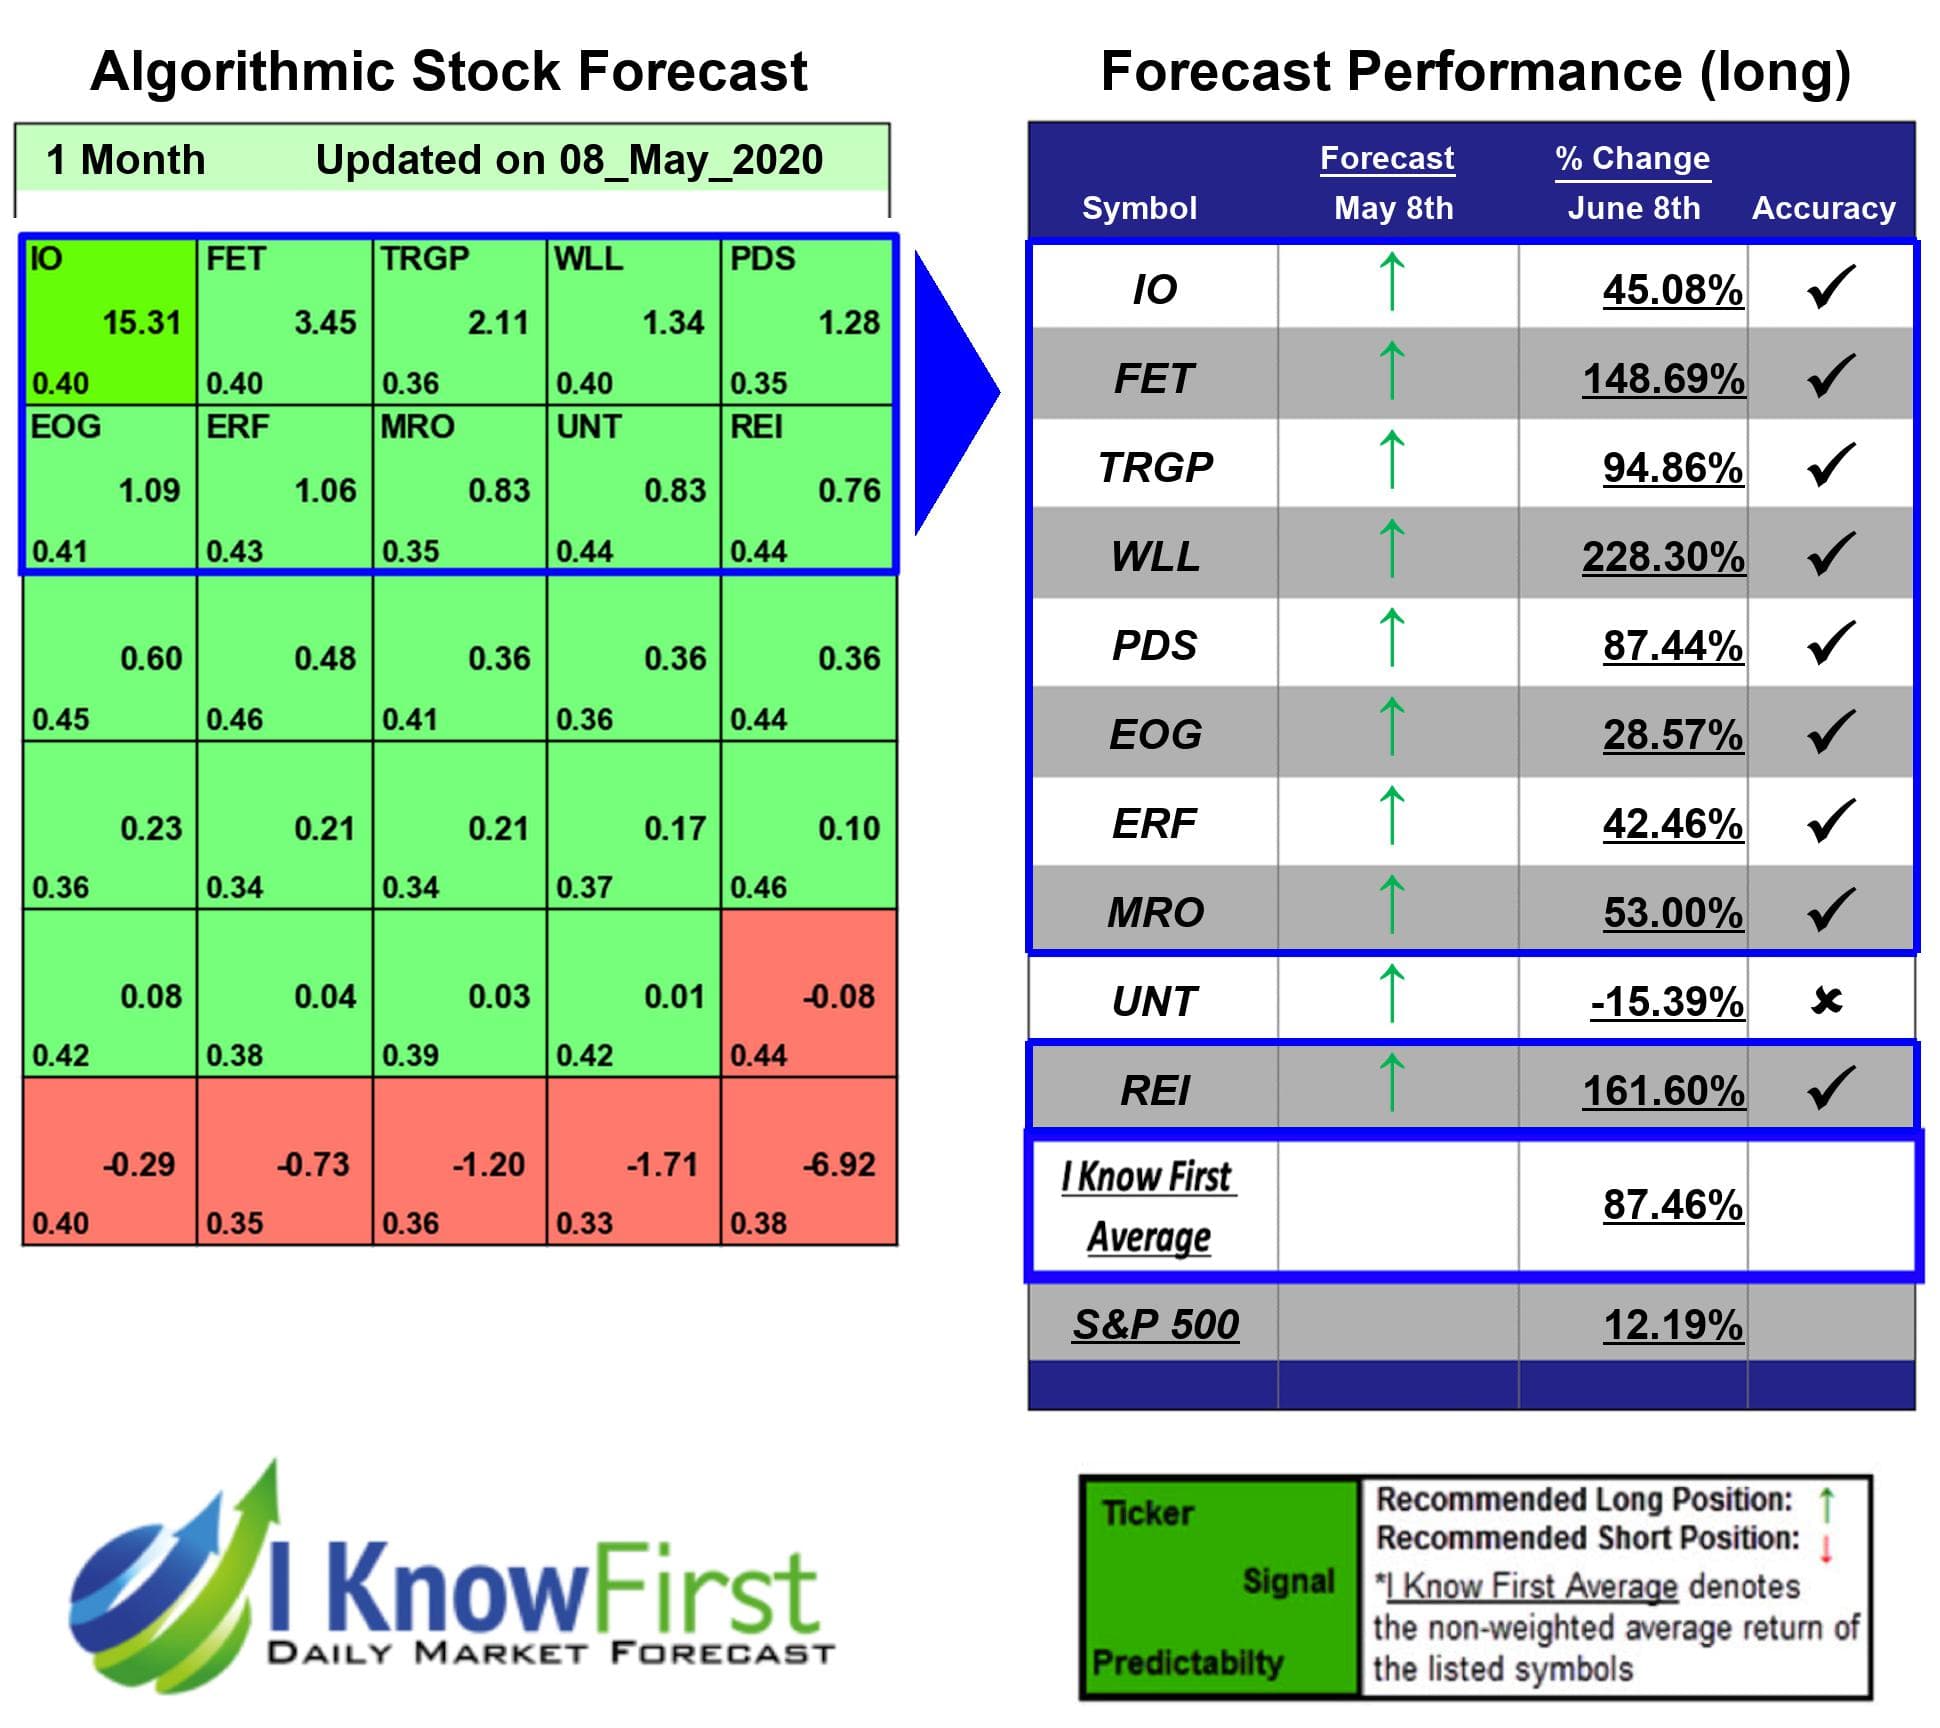
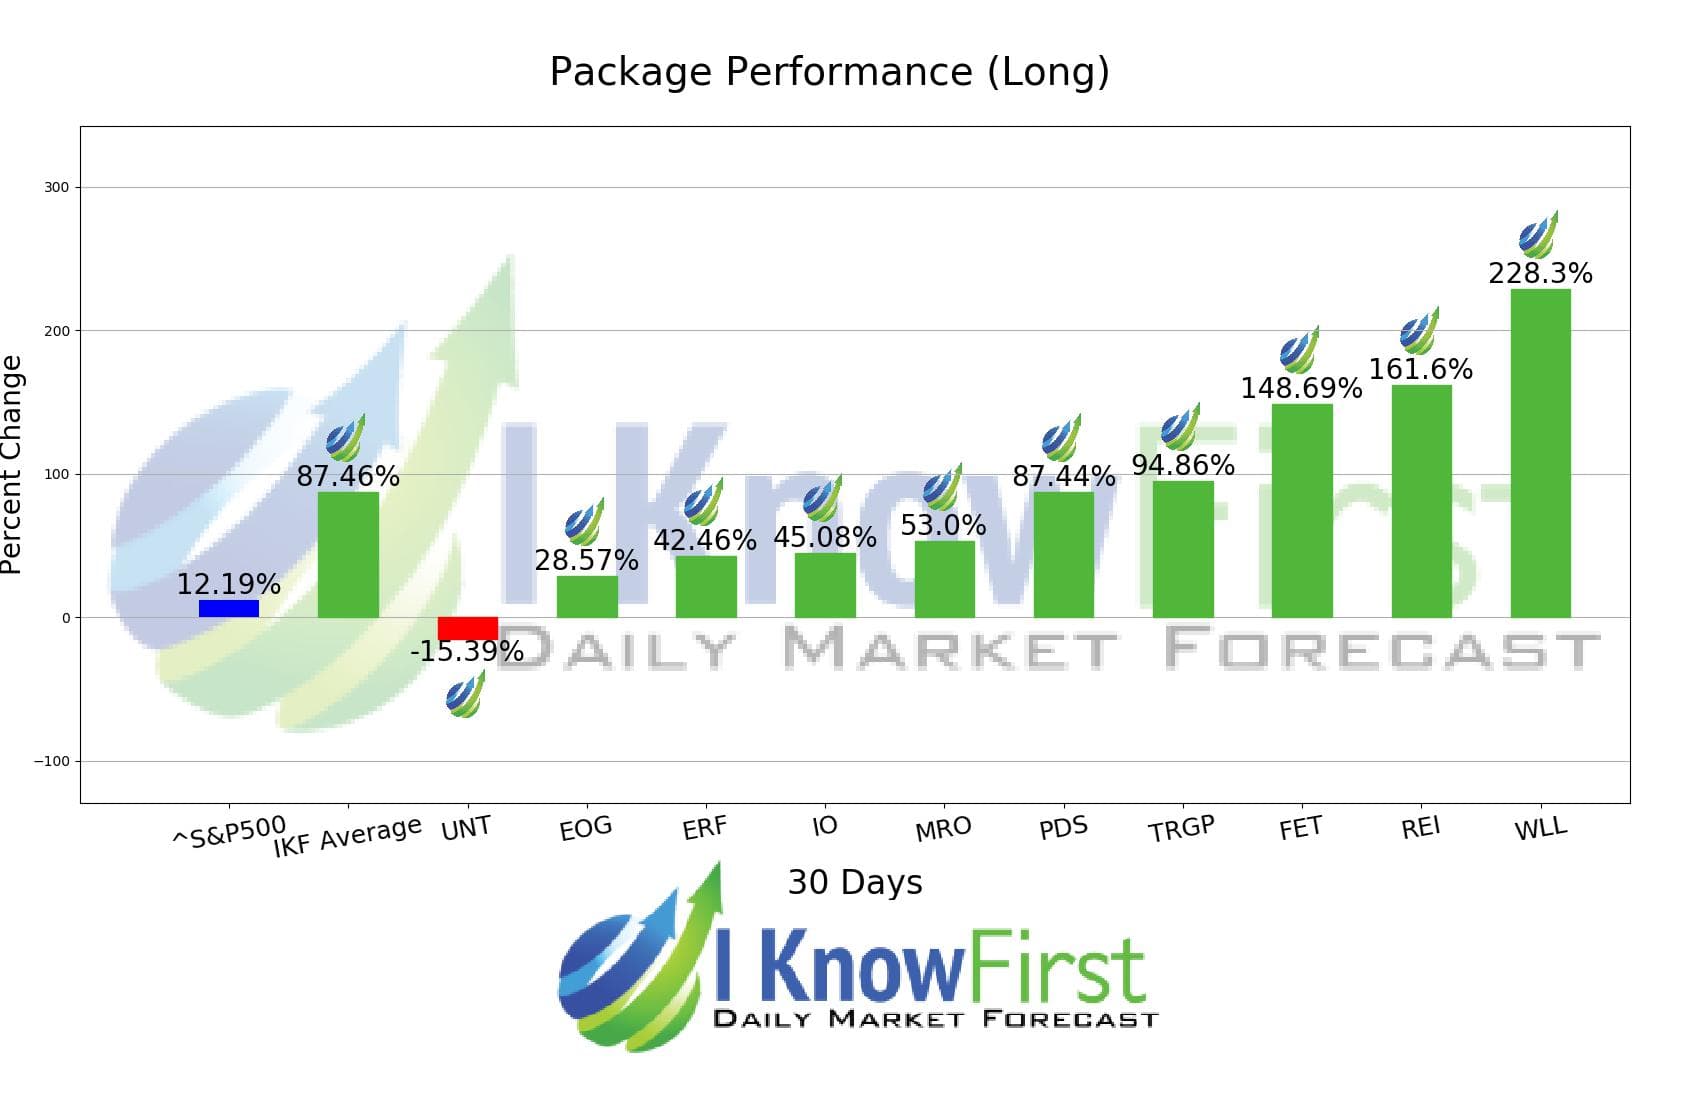
I Know First’s State of the Art Algorithm accurately forecasted 9 out of 10 trades in this Energy Stocks Forecast Package for the 1 Month time period. The highest trade return came from WLL, at 228.3%. REI, and FET had notable returns of 161.6% and 148.69%. The package had an overall average return of 87.46%, providing investors with a premium of 75.27% over the S&P 500’s return of 12.19% during the same period.
Whiting Petroleum Corp. (WLL) is an oil and gas company focusing in the development, exploration, acquisition, and production of crude oil and natural gas. With its headquarters in Denver, Colorado, the company’s operations spans in the Rocky Mountains and the Great Basin region.
Algorithmic traders utilize these daily forecasts by the I Know First market prediction system as a tool to enhance portfolio performance, verify their own analysis and act on market opportunities faster. This forecast was sent to current I Know First subscribers.
How to interpret this diagram
Algorithmic Stock Forecast: The table on the left is a stock forecast produced by I Know First’s algorithm. Each day, subscribers receive forecasts for six different time horizons. Note that the top 10 stocks in the 1-month forecast may be different than those in the 1-year forecast. In the included table, only the relevant stocks have been included. The boxes are arranged according to their respective signal and predictability values (see below for detailed definitions). A green box represents a positive forecast, suggesting a long position, while a red represents a negative forecast, suggesting a short position.
Please note-for trading decisions use the most recent forecast. Get today’s forecast and Top stock picks.


