
Best Brazilian Stocks Based on Deep-Learning: Returns up to 23.68% in 14 Days
Best Brazilian Stocks
This Best Brazilian Stocks forecast was generated by the I Know First Algorithm through its analysis of Brazil stock market data and is part of the By Country Package. The full forecast includes daily predictions for a total of 20 stocks with bullish and bearish signals:
- Top 10 Brazil stocks for the long position
- Top 10 Brazil stocks for the short position
![]()
![]()
Package Name: By Country – Brazilian Stocks
Recommended Positions: Long
Forecast Length: 14 Days (5/20/22 – 6/4/22)
I Know First Average: 7.33%
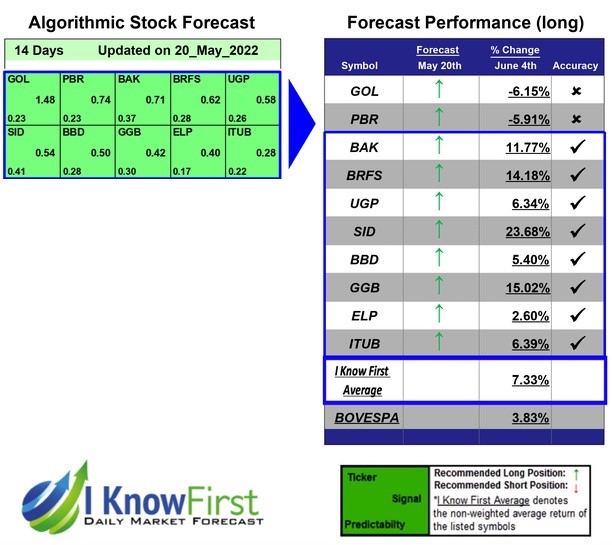
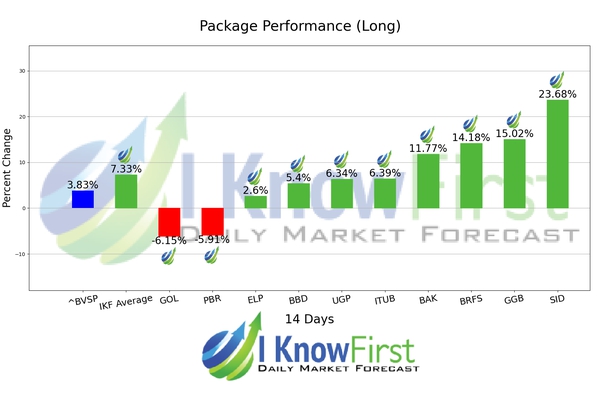
8 out of 10 stock prices in this forecast for the By Country – Brazilian Stocks Package moved as predicted by the algorithm. The greatest return came from SID at 23.68%. GGB, and BRFS had notable returns of 15.02% and 14.18%. The package had an overall average return of 7.33%, providing investors with a 3.50% premium over the Bovespa’s return of 3.83% during the period.
Companhia Siderúrgica Nacional ADR (SID) operates as an integrated steel producer primarily in Brazil. It operates through five segments: Steel, Mining, Cement, Logistics, and Energy. The company primarily produces carbon steel and various steel products for automotive, home appliance, packaging, construction, and steel processing industries.
Algorithmic traders utilize these daily forecasts by the I Know First market prediction system as a tool to enhance portfolio performance, verify their own analysis and act on market opportunities faster. This forecast was sent to current I Know First subscribers.
How to interpret this diagram
Algorithmic Stock Forecast: The table on the left is a stock forecast produced by I Know First’s algorithm. Each day, subscribers receive forecasts for six different time horizons. Note that the top 10 stocks in the 1-month forecast may be different than those in the 1-year forecast. In the included table, only the relevant stocks have been included. The boxes are arranged according to their respective signal and predictability values (see below for detailed definitions). A green box represents a positive forecast, suggesting a long position, while a red represents a negative forecast, suggesting a short position.
Please note-for trading decisions use the most recent forecast. Get today’s forecast and Top stock picks.


