
Best Bank Stocks Based on Big Data: Returns up to 19.14% in 14 Days
Best Bank Stocks
This forecast is designed for investors and analysts who need predictions of Bank Stocks (see Bank Stocks Package). It includes 20 stocks with bullish and bearish signals and indicates the best bank stocks to buy:
- Top 10 Bank stocks for the long position
- Top 10 Bank stocks for the short position

Package Name: Bank Stock Forecast
Recommended Positions: Long
Forecast Length: 14 Days (9/23/2020 – 10/7/2020)
I Know First Average: 4.73%
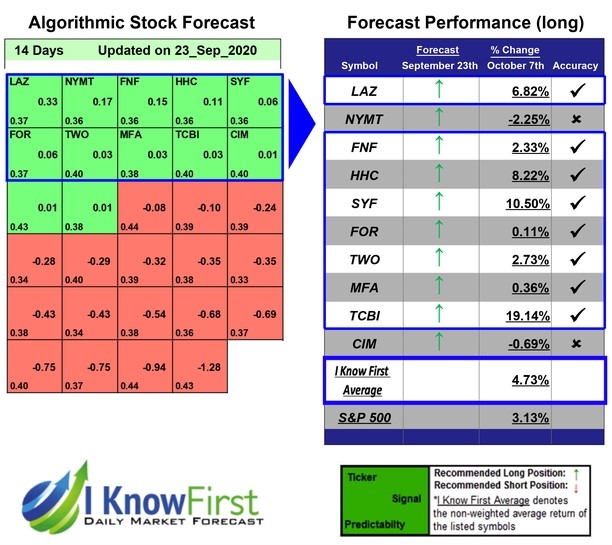
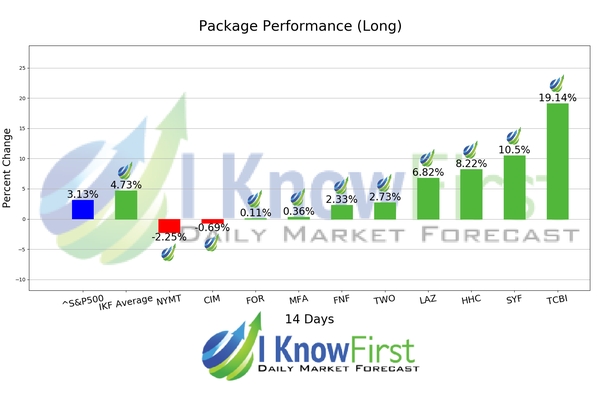
For this 14 Days forecast the algorithm had successfully predicted 8 out of 10 movements. The greatest return came from TCBI at 19.14%. SYF and HHC followed with returns of 10.5% and 8.22% for the 14 Days period. The package saw an overall yield of 4.73% versus the S&P 500’s return of 3.13% implying a market premium of 1.60%.
Texas Capital Bancshares, Inc. operates as the bank holding company for Texas Capital Bank, National Association that provides various banking products and services for commercial businesses, and professionals and entrepreneurs. It offers business deposit products and services, including commercial checking accounts, lockbox accounts, and cash concentration accounts, as well as other treasury management services.
Algorithmic traders utilize these daily forecasts by the I Know First market prediction system as a tool to enhance portfolio performance, verify their own analysis and act on market opportunities faster. This forecast was sent to current I Know First subscribers.
How to interpret this diagram
Algorithmic Stock Forecast: The table on the left is a stock forecast produced by I Know First’s algorithm. Each day, subscribers receive forecasts for six different time horizons. Note that the top 10 stocks in the 1-month forecast may be different than those in the 1-year forecast. In the included table, only the relevant stocks have been included. The boxes are arranged according to their respective signal and predictability values (see below for detailed definitions). A green box represents a positive forecast, suggesting a long position, while a red represents a negative forecast, suggesting a short position.
Please note-for trading decisions use the most recent forecast. Get today’s forecast and Top stock picks.


