
Best Automotive Stocks Based on a Self-learning Algorithm: Returns up to 94.98% in 1 Year
Best Automotive Stocks
This Automotive Stocks forecast is designed for investors and analysts who need predictions of the best-performing stocks in the automotive industry (see Automotive Stocks Package). It includes 20 stocks with bullish and bearish signals and indicates the best auto stocks to trade:
- Top 10 Automotive stocks for the long position
- Top 10 Automotive stocks for the short position
Package Name: Automotive Stock Forecast
Recommended Positions: Long
Forecast Length: 1 Year (10/18/20 – 10/19/21)
I Know First Average: 48.27%
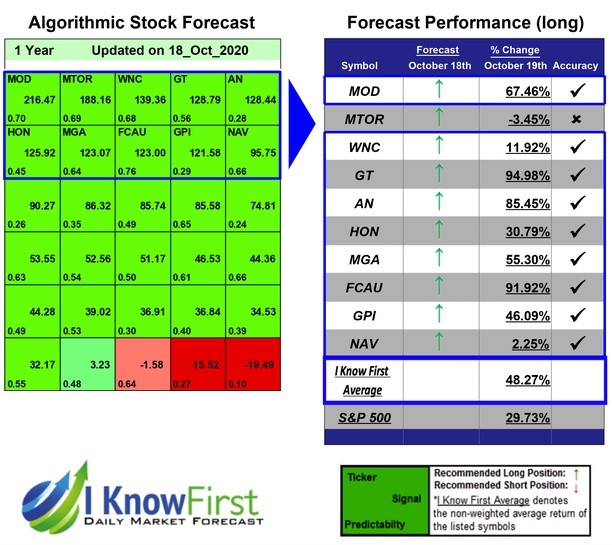

For this 1 Year forecast the algorithm had successfully predicted 9 out of 10 movements. The top performing prediction from this package was GT with a return of 94.98%. FCAU and AN also performed well for this time horizon with returns of 91.92% and 85.45%, respectively. The Automotive Stock Forecast package had an overall average return of 48.27%, providing investors with a premium of 18.54% over the S&P 500’s return of 29.73%.
The Goodyear Tire & Rubber Company, together with its subsidiaries, develops, manufactures, distributes, and sells tires and related products and services worldwide.
Algorithmic traders utilize these daily forecasts by the I Know First market prediction system as a tool to enhance portfolio performance, verify their own analysis and act on market opportunities faster. This forecast was sent to current I Know First subscribers.
How to interpret this diagram
Algorithmic Stock Forecast: The table on the left is a stock forecast produced by I Know First’s algorithm. Each day, subscribers receive forecasts for six different time horizons. Note that the top 10 stocks in the 1-month forecast may be different than those in the 1-year forecast. In the included table, only the relevant stocks have been included. The boxes are arranged according to their respective signal and predictability values (see below for detailed definitions). A green box represents a positive forecast, suggesting a long position, while a red represents a negative forecast, suggesting a short position.
Please note-for trading decisions use the most recent forecast. Get today’s forecast and Top stock picks.


