
Bank Stocks To Buy Based on Stock Prediction Algorithm: Returns up to 76.05% in 1 Year
Bank Stocks To Buy
This forecast is designed for investors and analysts who need predictions of Bank Stocks (see Bank Stocks Package). It includes 20 stocks with bullish and bearish signals and indicates the best bank stocks to buy:
- Top 10 Bank stocks for the long position
- Top 10 Bank stocks for the short position

Package Name: Bank Stock Forecast
Recommended Positions: Long
Forecast Length: 1 Year (1/5/21 – 1/5/22)
I Know First Average: 43.01%

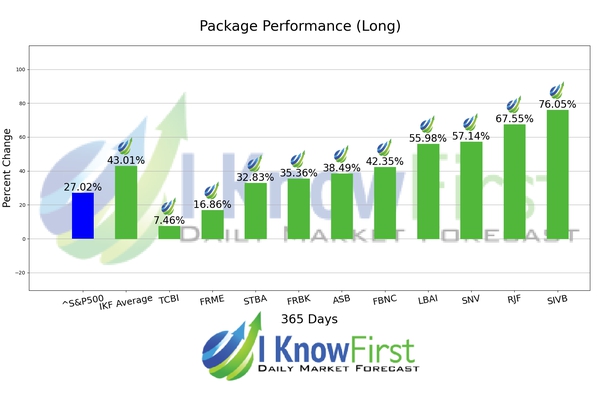
For this 1 Year forecast the algorithm had successfully predicted 10 out of 10 movements. The highest trade return came from SIVB, at 76.05%. RJF and SNV followed with returns of 67.55% and 57.14% for the 1 Year period. The package itself saw an overall return of 43.01%, providing investors with a 15.99% premium above the S&P 500’s return of 27.02% for the same time period.
SVB Financial Group (SVB Financial), incorporated on March 22, 1999, is a diversified financial services company, as well as a bank holding and a financial holding company. The Company operates through three segments: Global Commercial Bank, SVB Private Bank and SVB Capital. The Company, through its subsidiaries and divisions, offers a range of banking and financial products and services to clients across the United States. The Company offers services in the technology, life science/healthcare, private equity/venture capital and wine industries.
Algorithmic traders utilize these daily forecasts by the I Know First market prediction system as a tool to enhance portfolio performance, verify their own analysis and act on market opportunities faster. This forecast was sent to current I Know First subscribers.
How to interpret this diagram
Algorithmic Stock Forecast: The table on the left is a stock forecast produced by I Know First’s algorithm. Each day, subscribers receive forecasts for six different time horizons. Note that the top 10 stocks in the 1-month forecast may be different than those in the 1-year forecast. In the included table, only the relevant stocks have been included. The boxes are arranged according to their respective signal and predictability values (see below for detailed definitions). A green box represents a positive forecast, suggesting a long position, while a red represents a negative forecast, suggesting a short position.
Please note-for trading decisions use the most recent forecast. Get today’s forecast and Top stock picks.


