
APP Stock Forecast: Not Every AI Stock is Overvalued

(Source:bloomberg.com)
Highlights
- EBITDA and net income margins above peer averages
- DCF valuation says APP is undervalued
- E-commerce and connected TV expansion may see meaningful growth
Overview
AppLovin Corporation is a mobile marketing and advertising technology company headquartered in Palo Alto, California. Founded in 2011 by Adam Foroughi, John Krystynak, and Andrew Karam, the company operates a platform that helps mobile app developers with user acquisition, ad monetization, and analytics through products including AppDiscovery, MAX, and Adjust. Its core advertising engine relies heavily on AI-powered optimization, which management credits for a large share of recent revenue growth. Beyond its advertising software, AppLovin also owns a portfolio of mobile games, including Monopoly GO!, though the company has been shifting its focus toward its advertising business as the primary growth driver. AppLovin trades on the Nasdaq under the ticker APP and is classified as a mega-cap technology stock.
Financially, AppLovin has shown strong momentum, generating $5.48 billion in revenue for fiscal year 2025 and $6.83 billion on a trailing twelve-month basis as of June 30, 2026, alongside net income of $3.33 billion for 2025. In its second quarter of 2026, the company reported revenue of $1.92 billion, up 53 percent year over year, and adjusted EBITDA of $1.61 billion, up 58 percent year over year, though both figures came in slightly below guidance and analyst expectations, which sent the stock down sharply following the report. As of August 10, 2026, shares trade around $346.80, giving the company a market capitalization of roughly $116.06 billion, well off its 52-week high of $745.61 as investors reassess growth expectations after the earnings miss. The balance sheet remains solid, with $3.05 billion in cash against $3.7 billion in total debt, putting net leverage near 0.1 times trailing adjusted EBITDA.
Financial Results
Source: Capital IQ, FY 2025 Data
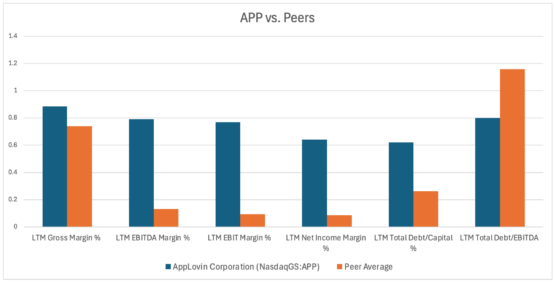
(Figure 1: APP vs. Peers for profitability margins and debt structure.)
AppLovin significantly outperforms its peer group across every profitability metric shown. Its LTM gross margin of roughly 88 percent tops the peer average of about 74 percent, and the gap widens dramatically further down the income statement: AppLovin’s EBITDA margin of around 79 percent dwarfs the peer average of just 13 percent, its EBIT margin of about 77 percent compares to a peer average near 9 percent, and its net income margin of roughly 64 percent stands well above the peer average of about 8 percent. This pattern suggests AppLovin converts revenue into profit far more efficiently than comparable companies, likely reflecting its asset-light, software-driven advertising model and the operating leverage in its AI-powered ad engine.
The leverage picture is more mixed. AppLovin’s total debt to capital ratio of about 62 percent is notably higher than the peer average of roughly 26 percent, indicating the company relies more heavily on debt financing relative to its capital structure. However, when leverage is measured against cash flow generation, AppLovin actually looks healthier than peers: its total debt to EBITDA ratio of about 0.8 times is lower than the peer average of roughly 1.16 times. In other words, AppLovin carries a debt-heavy capital structure in relative terms, but its exceptional EBITDA generation means that debt is easier to service and pay down than for the average peer.
Source: Capital IQ, FY2021 to FY2025 Data
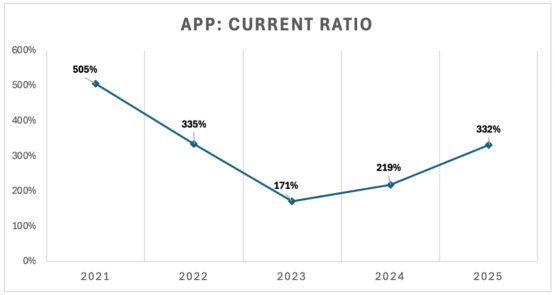
(Figure 2: FY2021 to FY2025 APP’s Current Ratio)
AppLovin’s current ratio has followed a pronounced U-shaped path since 2021. It started at a very strong 505 percent, reflecting a large cushion of current assets, likely cash and short-term investments, relative to current liabilities in the years following its 2021 IPO. The ratio then declined steadily through 2022 and 2023, falling to 335 percent and then to a low of 171 percent, as the company scaled its advertising business, took on debt for acquisitions such as MoPub and Adjust, and built up current liabilities alongside its rapid growth.
Since bottoming in 2023, the ratio has recovered, climbing to 219 percent in 2024 and 332 percent in 2025. This rebuilding of liquidity lines up with AppLovin’s sharp swing toward profitability and strong free cash flow generation over the past two years, as the company’s AI-driven advertising engine scaled and margins expanded significantly. Even at its low point in 2023, a ratio of 171 percent still indicated current assets comfortably exceeded current liabilities, so AppLovin has maintained solid short-term liquidity throughout the period, and the 2025 level of 332 percent reflects a business now generating far more cash than it needs to cover near-term obligations.

Source: Capital IQ, FY2021 to FY2025 Data
(Figure 3: FY2021 to FY2025 APP’s Debt-to-Equity Ratio)
AppLovin’s debt-to-equity ratio rose steadily from 1.6 times in 2021 to a peak of 3.3 times in 2024, more than doubling over three years. This buildup reflects the company’s heavy use of debt to fund acquisitions and share buybacks during its growth phase, including deals like MoPub and Adjust, while a period of thinner profitability and an active repurchase program kept its equity base relatively compressed even as borrowings climbed.
The sharp drop to 1.7 times in 2025 marks a significant deleveraging, bringing the ratio back down near its 2021 and 2022 levels. This turnaround aligns with AppLovin’s dramatic swing into strong, sustained profitability over the past two years, which has both rebuilt retained earnings and equity on the balance sheet and generated the free cash flow needed to pay down debt. Taken together with the current ratio recovery in the previous chart, the pattern points to a balance sheet that stretched considerably through the acquisition and buyback-heavy years around 2023 and 2024, and has since been repaired quickly on the back of the company’s improved operating performance, though the 2024 peak is worth flagging if this report discusses leverage risk or credit quality.
Future Business Outlook
Looking ahead, AppLovin’s growth story centers heavily on expanding beyond mobile gaming into e-commerce and connected TV advertising. Management points to its AXON 2 optimization engine, which has converted roughly 95 percent of incremental revenue into EBITDA, as the key technology enabling this expansion, and analysts have raised e-commerce revenue projections for 2026 to around $1.45 billion from earlier estimates near $1.05 billion. Consensus estimates still call for substantial growth, with EPS projected to rise from about $10.04 in fiscal 2025 to roughly $15.93 in fiscal 2026 and $20.89 in fiscal 2027, and the company’s self-serve Axon advertising platform is viewed as a major lever for expanding its advertiser base beyond gaming.
That said, the outlook carries real uncertainty following the Q2 2026 earnings miss, which triggered a sharp selloff and multiple price target cuts from firms including Piper Sandler, Deutsche Bank, Raymond James, and RBC. Several analysts have flagged a potential plateau in mobile game wallet share, noting AppLovin already captures roughly half of user acquisition spend in mobile gaming, meaning future growth increasingly depends on unproven adoption of Axon self-serve and e-commerce products rather than its established core business. The stock’s high beta of about 2.48 also makes it unusually sensitive to broader market swings. Overall, sell-side sentiment remains constructive with a majority of buy ratings and price targets still well above current levels, generally in the $560 to $860 range, but the recent guidance miss has introduced more skepticism about whether AppLovin can sustain its historical growth rate as its core gaming business matures.
Stock Forecast: Discounted Cash Flow Model (DCF)


Source: APP Stock Valuation Model
(Figure 4: Discounted Cash Flow Valuation Summary & Sensitivity Analysis)
The DCF implies a base case value of $531 per share, well above AppLovin’s market price of $339.71 as of July 27, 2026, supporting the model’s Buy recommendation and pointing to roughly 56 percent implied upside. This value is built on an enterprise value of about $182.9 billion, a discounted 15.17 percent WACC, and a 3 percent terminal growth rate, which the sensitivity table shows landing at $528.37, close to the headline $531 figure. The sensitivity grid highlights how much the output swings with assumptions: at a lower 14.00 percent WACC and 5 percent terminal growth, value per share rises to $719, while at a higher 16.00 percent WACC and just 1 percent terminal growth, it falls to $429, still above the current trading price in every scenario shown, which suggests the valuation gap is not simply a function of aggressive assumptions.
The trading multiples section adds useful context and shows a mixed picture. AppLovin trades at a notable premium on revenue, 15.2 times forward revenue versus a peer average of 8.34 times, but at a discount on EBITDA and earnings, 18.0 times forward EBITDA versus a peer average of 24.65 times, and 22.9 times forward earnings versus a peer average of 35.10 times. That combination is consistent with a market that is paying up for AppLovin’s growth and margin profile on a revenue basis, while still discounting its earnings power relative to peers, perhaps due to the growth deceleration concerns raised in the outlook discussion.
Stock Forecast: Multiples Valuation

Source: APP Stock Valuation Model, Capital IQ
(Figure 5: APP Multiples Valuation Summary)
This multiple-based valuation reinforces the same story as the DCF. Applying peer average P/E and EBITDA multiples to AppLovin’s forward earnings and EBITDA produces implied values of $513 and $518 per share, respectively, both closely aligned with each other and with the DCF’s $531 base case output, and both well above the current market price around $340. That convergence across two different valuation methods, one income-based and one comparables-based, strengthens the case that AppLovin looks undervalued relative to its growth and profitability profile if peer multiples are applied.
The revenue multiple tells a very different story, implying just $191 per share, far below both the current price and the other two multiple-based estimates. This divergence is explained directly by the trading multiples table: AppLovin trades at 15.24 times forward revenue versus a peer average of only 8.34 times, meaning the market already assigns AppLovin a substantial premium on revenue, so applying the lower peer average multiple to AppLovin’s revenue mechanically produces a much smaller value. In other words, the revenue multiple undervaluation is really just a reflection of AppLovin’s superior margins, since investors pay more per dollar of AppLovin revenue precisely because it converts to far more EBITDA and net income than peer revenue does, as shown by AppLovin trading at a discount on the EBITDA and P/E multiples despite the revenue premium. For the report, it is worth noting this inconsistency explicitly and probably weighting the EBITDA and P/E based multiples, along with the DCF, more heavily than the revenue multiple when forming a blended valuation conclusion.

Source: APP Stock Valuation Model, Capital IQ
(Figure 6: APP Multiples Comparison with Peers)
This comparable company set spans a fairly diverse mix of software and technology businesses: Datadog and HubSpot are cloud subscription software companies, Take Two is a video game publisher with a business model closer to AppLovin’s gaming roots, Palantir is a high-growth AI and data analytics company carrying premium multiples across the board, and Autodesk is a more mature, steady growth design software company. On the revenue multiple, AppLovin’s 15.2 times sits in the middle of the pack, well above legacy or value-oriented names like Take Two at 5.4 times, Autodesk at 5.8 times, and HubSpot at 2.8 times, but below the high-growth names Datadog at 20.2 times and Palantir at 33.6 times, placing AppLovin closer to the premium growth tier of the group on a revenue basis.
The EBITDA and P/E multiples tell a more favorable story for AppLovin’s relative valuation. At 18.0 times forward EBITDA and 22.9 times forward earnings, AppLovin is cheaper than every peer in the set except HubSpot and Autodesk, and dramatically cheaper than Datadog at 79.7 times EBITDA and 108.7 times earnings, or Palantir at 55.4 times EBITDA and 77.3 times earnings. This pattern is consistent with the earlier observation that AppLovin converts revenue into profit far more efficiently than most software peers, so even though the market prices its revenue at a premium relative to slower-growing or lower margin names, its earnings and cash flow multiples still look inexpensive next to the group’s higher growth, lower margin members. For the report, this table supports the argument that AppLovin’s premium revenue multiple is justified and, arguably, conservative once profitability is factored in.
Stock Forecast: Analysts’ Consensus

Source: Bloomberg LLP
(Figure 7: Analyst Recommendations for APP as of 8/3/2026)
Sell-side sentiment toward AppLovin remains overwhelmingly positive on this screen, with a consensus rating of 4.75 out of 5, 33 buy ratings representing 91.7 percent of coverage, only 2 holds and a single sell, alongside one standout short rating from Hedgeye Risk Management. The average 12-month price target implies 60.7 percent upside from the $412.09 last price shown, and individual targets range widely, from UBS’s Stephen Ju at $798. Raymond James’s Andrew Marok at $640 on the bullish end, down to Arete Research’s David Mak at $406 with a neutral rating, reflecting real dispersion in how analysts weigh the growth story against the risks discussed earlier in the report.
One important caveat for the report: this snapshot is dated August 3, 2026, just before AppLovin’s Q2 earnings release on August 6 that triggered the roughly 19 to 21 percent selloff discussed previously, so the $412.09 reference price and many of these targets predate that move and are already stale. As noted in the outlook section, several firms, including Piper Sandler, Deutsche Bank, Raymond James, and RBC, cut their price targets following the earnings miss, with RBC’s Matthew Swanson’s target here at $700 likely revised downward since. It is worth pulling an updated ANR screen dated after August 6 before finalizing the report, so the consensus rating and target prices reflect current post-earnings sentiment rather than the more optimistic pre-earnings view captured here.
Conclusion
AppLovin presents a compelling, if volatile, investment case. The company has built an unusually profitable business, with gross, EBITDA, and net income margins that dwarf its peer group, and a balance sheet that, despite a leverage spike in 2023 and 2024 tied to acquisitions and buybacks, has since been repaired quickly through strong free cash flow generation. Both the discounted cash flow analysis and the EBITDA and P/E based multiple valuations converge on a fair value in the $510 to $530 per share range, meaningfully above the stock’s recent trading levels in the $340 to $410 range, and this gap is corroborated by broad sell side support, with 91.7 percent of covered analysts rating the stock a buy and an average price target implying substantial upside even before accounting for likely post earnings target revisions.
That said, the investment thesis is not without real risk. The stock’s history of sharp valuation resets, most recently the 19 to 21 percent drop following the Q2 2026 earnings miss, reflects genuine uncertainty about whether AppLovin can sustain its historical growth rate as its core mobile gaming advertising business approaches saturation, now commanding roughly half of industry user acquisition spend. Future upside increasingly depends on unproven expansion into e-commerce and connected TV advertising through the Axon self-serve platform, success that is not yet fully reflected in current results and remains a key swing factor for both revenue growth and the premium the market assigns to AppLovin’s revenue multiple. On balance, the combination of superior profitability, a recovering balance sheet, and valuation support from multiple independent methods points toward a favorable risk-reward setup, consistent with the Buy recommendation, though investors should size positions with the stock’s high volatility and its dependence on unproven growth initiatives in mind.

It is worth paying attention that the stock-picking AI of I Know First has a high signal on the one-year market trend forecasts. The light green for the short-term forecasts is mildly bullish, while the darker green is a strong bullish signal for all forecast horizones.

To subscribe today click here.
Please note-for trading decisions use the most recent forecast.


