
Algorithmic Trading Tip: Deriving Information From a Heatmap
I Know First’s general products offer a set number of stocks. For example a tech stock forecast only shows the top 10 stocks to buy, and bottom 10 stocks to sell. Because the table does not include the S&P forecast, it does not mean you don’t have the general market direction. The table below shows a forecast where the entire market for tech stocks is likely to go up, thus we assume the index forecast is positive (even without it being included in the package), and the results show the S&P500 went up by 13.52% in 1 year.

Out of all the stocks only a few had a negative signal. Also the bullish signals were much stronger than the bearish, leading to a rising market assumption. This is a great time to invest. Conversely a table could look as follows,
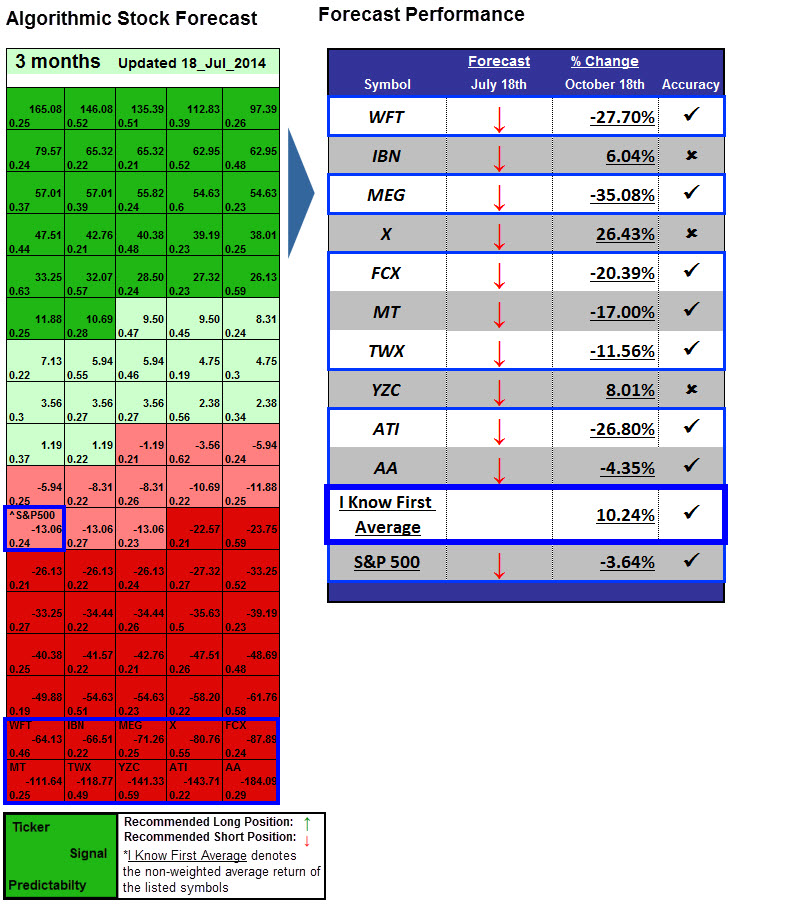
Here the table is divided about half bullish and half bearish (you don’t need to see the specific assets, just the signals). More importantly the “top 10 stocks + S&P500” actually gives you the index’s forecast, meaning the entire market is predicted to decline (signal strength -13.06), and thus by going bullish you are investing against the market as a whole. Moreover, you can see here that the bearish signals are stronger. This presents an opportunity to short a stock, or maybe exit your positions and invest again when the market looks better. Some investor will jump to a completely different market such as Gold or Currencies.
All institutional, and some private investors wish to see a specific stocks position all the time (even when it is not in the top or bottom 10). With a 1 year commitment, instead of getting only the top and bottom 10 stocks, you will also get the position of your 10 stocks wherever they are on the chart free of charge. If you would like more details please fill out the contact form here.
Contact Form
Related:
Algorithmic Trading Tip: Reading a Heatmap’s Indicators
Algorithmic Trading Tip: Follow the Signal


