
52 Week Low Stocks Based on Stock Algorithm: Returns up to 56.19% in 1 Year
52 Week Low Stocks
The 52 Week Low Stocks Package is designed for investors and analysts who need predictions for stocks currently at their 52-week low price level, offering the best market opportunities based on algo-trading. It includes 20 stocks with bullish and bearish signals and indicates the best stocks to invest in:
- 52 Weeks Low Top 10 stocks for the long position
- 52 Weeks Low Top 10 stocks for the short position

Package Name: 52 Week Low Stocks
Recommended Positions: Long
Forecast Length: 1 Year (9/6/2018 – 9/6/2019)
I Know First Average: 9.04%
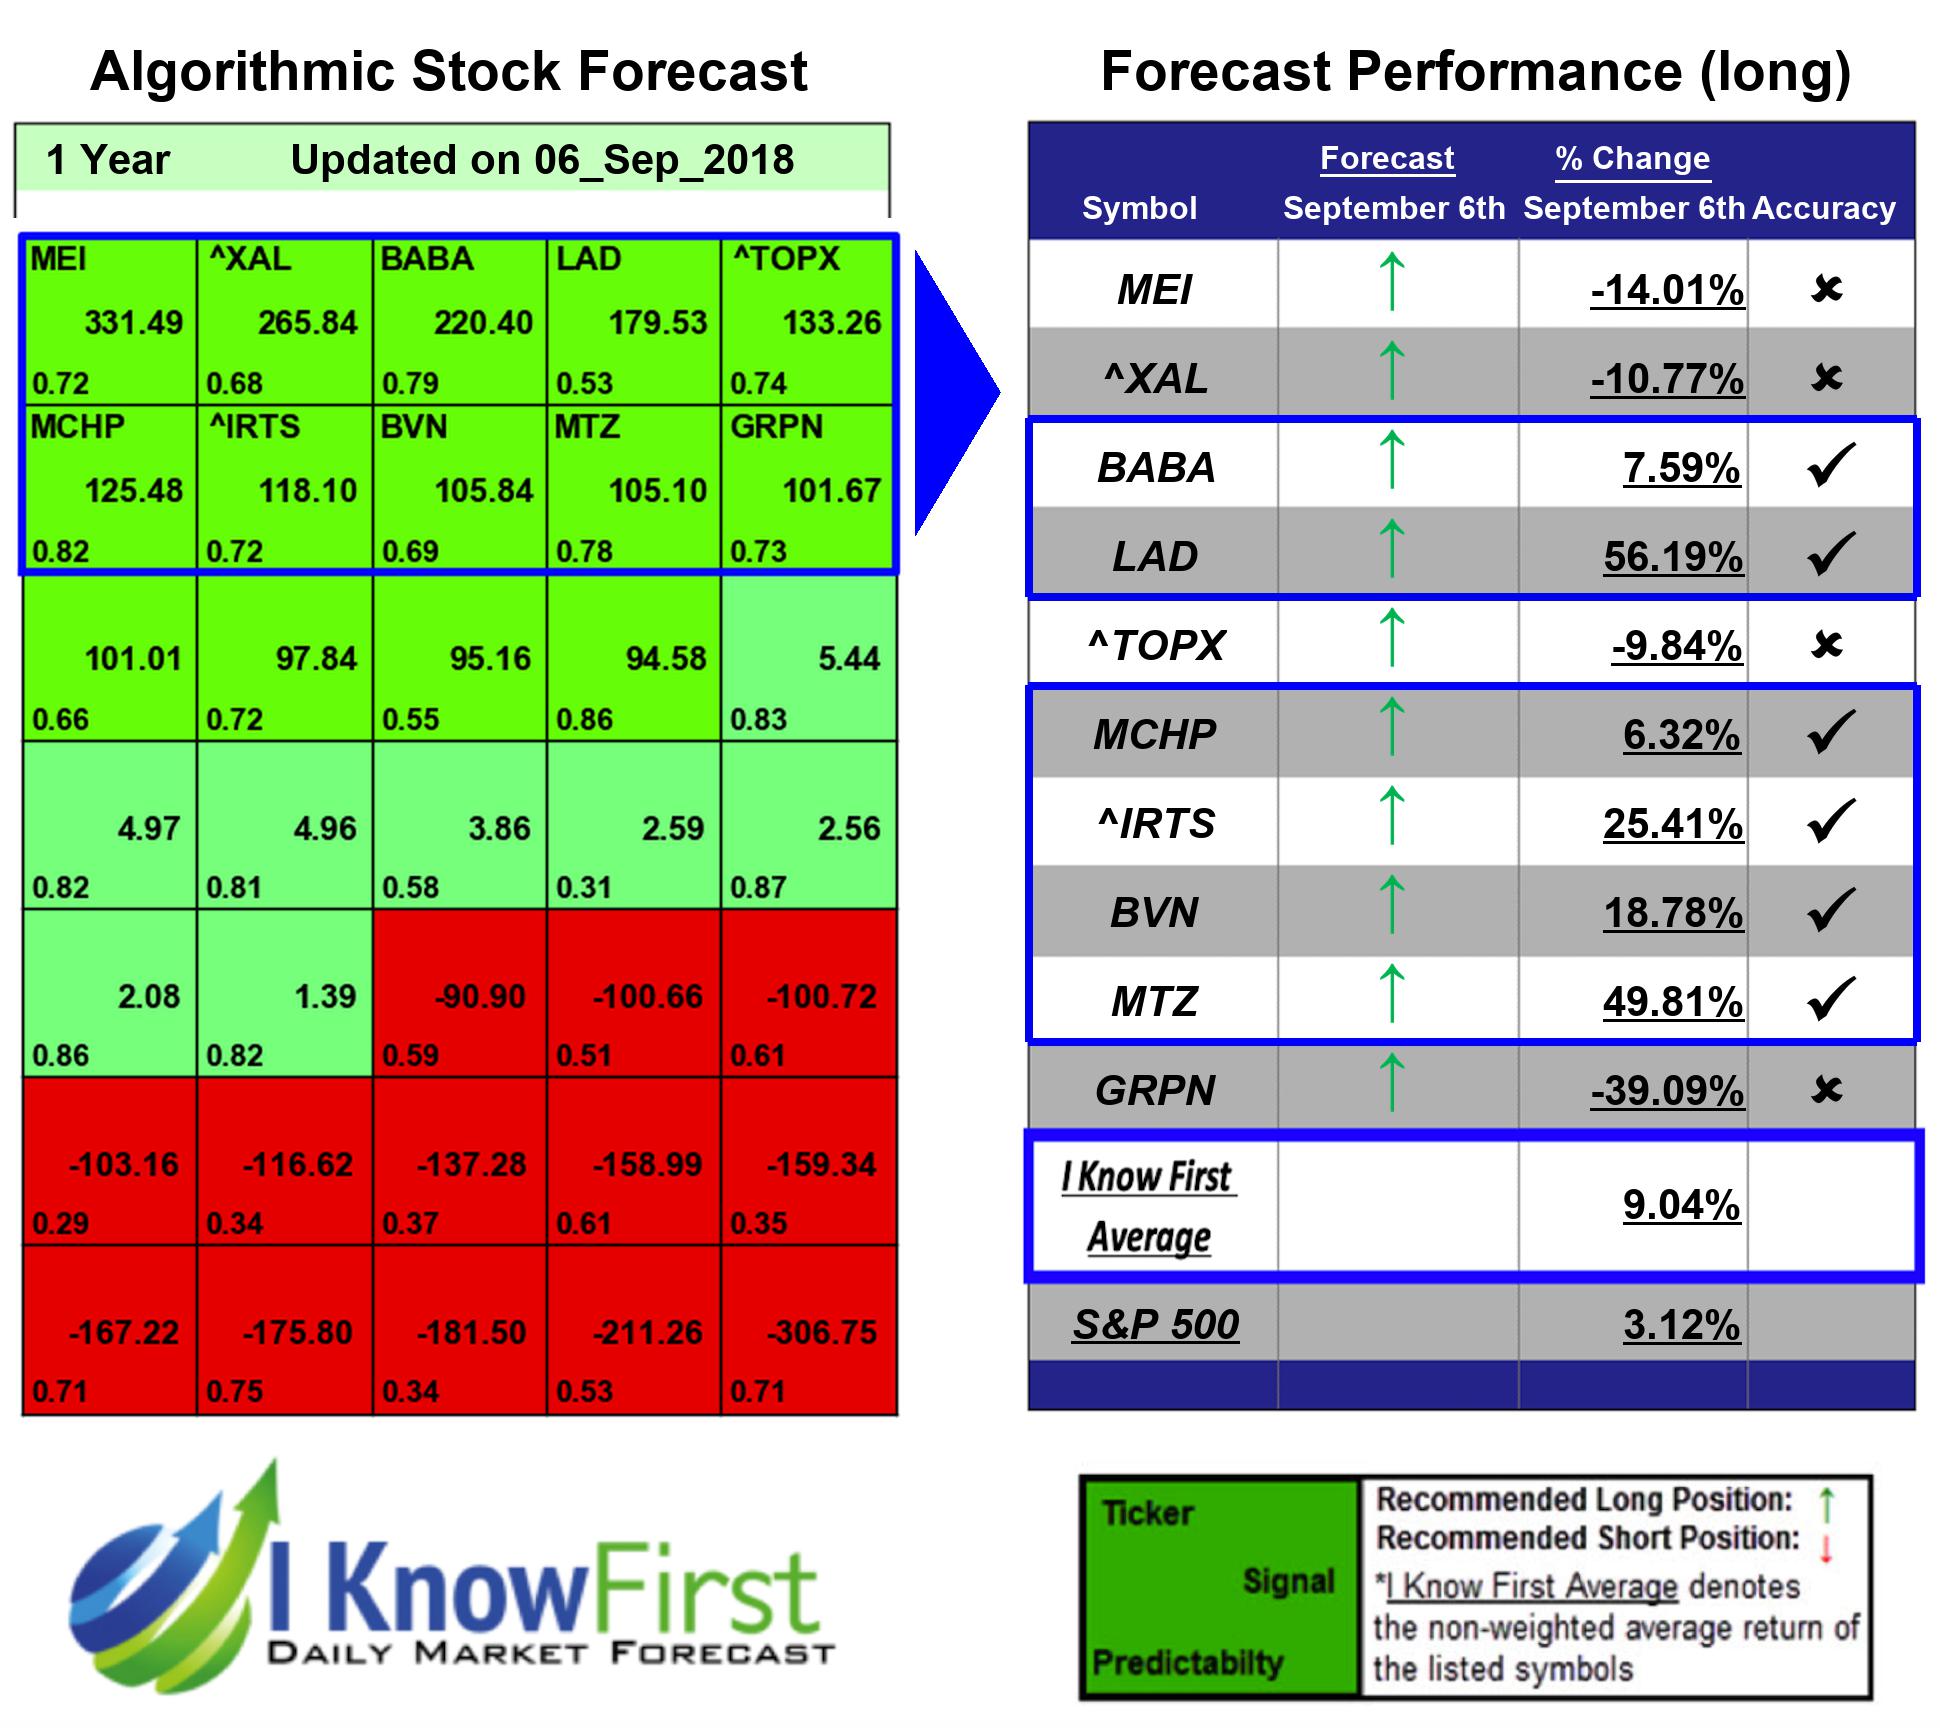

In this 1 Year forecast for the 52 Week Low Stocks Package, there were many high performing trades and the algorithm correctly predicted 6 out 10 trades. The top performing prediction from this package was LAD with a return of 56.19%. Additional high returns came from MTZ and ^IRTS, at 49.81% and 25.41% respectively. The 52 Week Low Stocks package had an overall average return of 9.04%, providing investors with a premium of 5.92% over the S&P 500’s return of 3.12%.
Lithia Motors, Inc. (LAD) operates as an automotive franchises and a retailer of new and used vehicles in the United States. The company operates through three segments: Domestic, Import, and Luxury. It sells new and used cars, replacement parts, service contracts, vehicle protection products, and credit insurance products; provides vehicle maintenance, warranty, paint, and repair services; and arranges related financing. As of September 1, 2016, the company offered 31 brands of new vehicles and various brands of used vehicles in 141 stores in the United States; and online through Lithia.com and DCHauto.com. Lithia Motors, Inc. (LAD) was founded in 1946 and is headquartered in Medford, Oregon.
Algorithmic traders utilize these daily forecasts by the I Know First market prediction system as a tool to enhance portfolio performance, verify their own analysis and act on market opportunities faster. This forecast was sent to current I Know First subscribers.
How to interpret this diagram
Algorithmic Stock Forecast: The table on the left is a stock forecast produced by I Know First’s algorithm. Each day, subscribers receive forecasts for six different time horizons. Note that the top 10 stocks in the 1-month forecast may be different than those in the 1-year forecast. In the included table, only the relevant stocks have been included. The boxes are arranged according to their respective signal and predictability values (see below for detailed definitions). A green box represents a positive forecast, suggesting a long position, while a red represents a negative forecast, suggesting a short position.
Please note-for trading decisions use the most recent forecast. Get today’s forecast and Top stock picks.


